See for example these posts by Elizabeth Warren and Brad DeLong. The authors of the NY Times article, David Leonhardt and Motoko Rich, kindly supply some interactive graphics and tables as well as a detailed Excel spread sheet of data from 1979 to the present, covering literally hundreds of cities, metro areas, and rural areas.
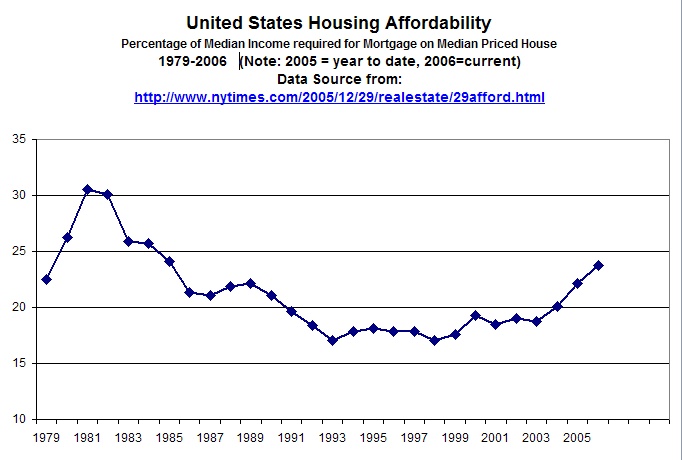
This is a good thing since their article while it is long on examples, is short on actually showing the pictures that make the trends. The graphs they do make available prove dfficult to see what is going on. Here for example is their graph showing the affordability pattern for the US as whole for the entire period.
 The scale goes to 100% and makes it difficult to see what's going on. The interactive graphics allow you to see graphs for other cities or areas, but these are also scaled to 100% severely limiting understanding.
Contrast the original graphic to the one below scaled with a Y axis from 10 to 25. The patterns are a lot easier to read off the graph.
My reading is that using the metric of affordability suggested by the article (percentage of median income required for the mortgage on the median priced home) it is pretty clear that for the US as a whole, housing is becoming less affordable which is not the impression you will get when you read the article.
What do you think?
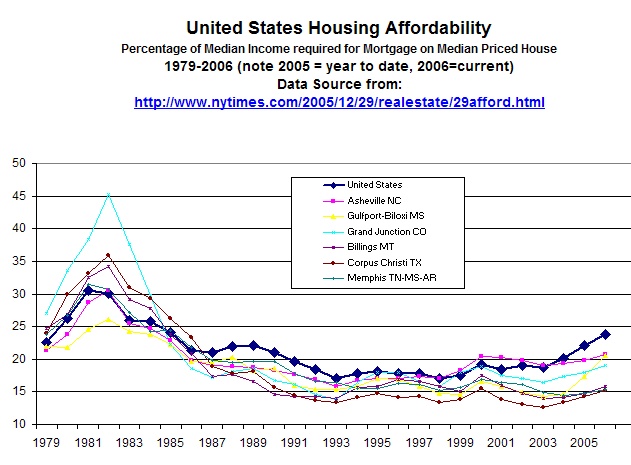
Now look at the the same graph from 1996 to the present time. It appears to me that using this metric, housing is getting less and less affordable.

Bottom line: if what you want to understand are the trends that matter most in our lives, there is no substitute for atually providing easy to read graphs that show the key indicators. Talking about trends in text is simply not even a close contender for explanatory power.
Footnote: I believe the metric they use for affordability actually distorts the affordability story, but that is a topic for another post.
No comments:
Post a Comment