The BLS kindly provided each of these charts with its own "pedigree papers" - the underlying data set for the factor in question over the time period shown. This is rarely done today for reporting on the internet or in print.
When someone shares their data as in this case, it opens up the possibility for further fruitful conversations. Here's an example of what I am talking about.
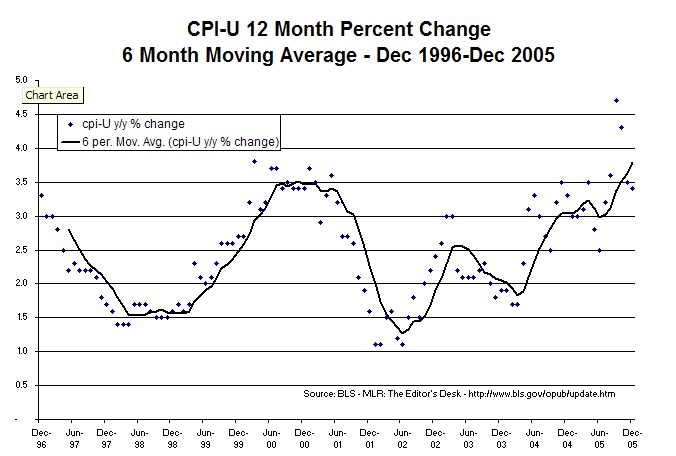
Using the BLS data, I was able to create the charts below in a relatively small number of minutes. I liked what the BLS had done, yet I also had a theory that perhaps some further smoothing might make the patterns easier to read or understand. With the 6 month moving average of these year over year percent changes in CPU-U, the upward thrust of this key factor over the past year stands out more clearly.
----------------NOT SEASONALLY ADJUSTED-------------
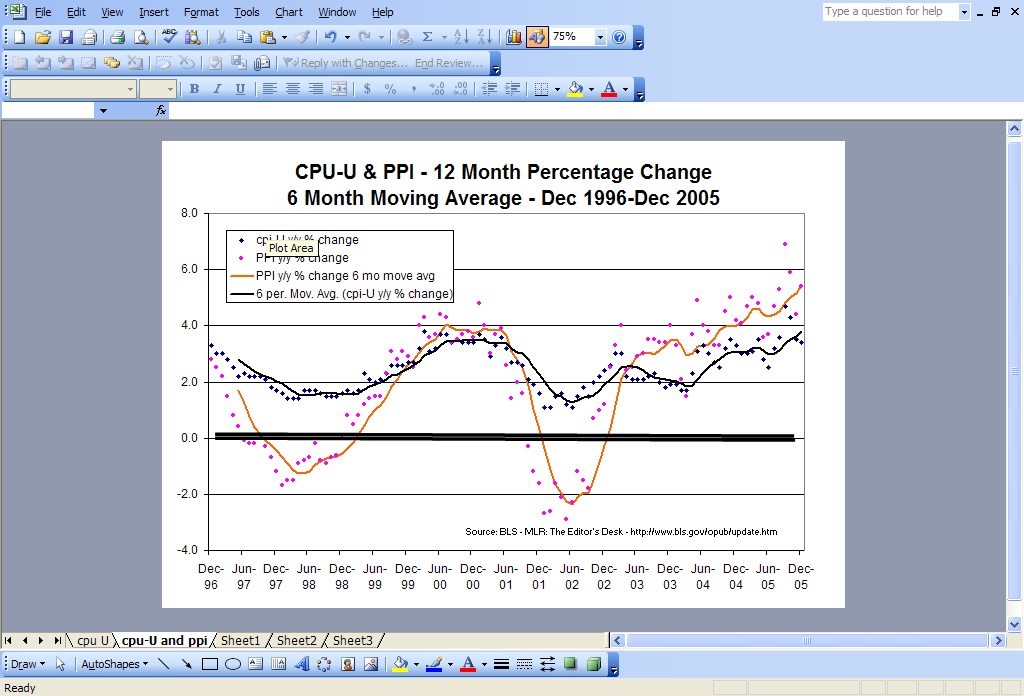
Looking at the BLS charts for CPI and PPI, I wondered how these two key factors were related. Again, because BLS provided the data for both factors, I was able to create this second chart that shows both of these key factors together. From this new chart, one might theorize that the rapidly rising PPI over the past 2+ years has been a factor in dragging the CPI higher over the same period.
What do you see? What do you think?
----------------NOT SEASONALLY ADJUSTED-------------

Sharing the data: This is important because the same data can be presented in many different ways and used to test many different theories. If an analyst or reporter pulls together a data set and then shares a small number of charts (quite commonly only one chart) and does not share his or her data, then further analysis is made more complicated and more expensive by a factor of 10 or more.
Ready Reusability: The BLS data made the work above possible within the time constraints that I am operating under today. However, my job could have been even easier if these two related metrics - cpi and ppi - had been placed together in a single, easy to use data set.
See the next post for your copy of the data set I constructed just in case you want to continue the analysis and discussion.
No comments:
Post a Comment