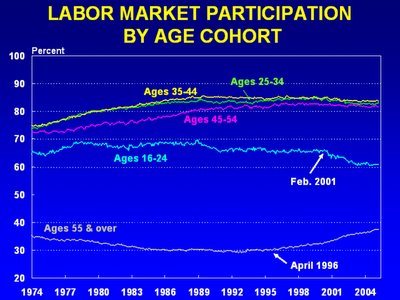
The new multi-dimensionality (15 additional factors breaking down the aggregate Labor Force Participation percentage) brings out details and important insights previously invisible to the eye.
Something pretty dramatic is happening recently for the age groups 16-24 and 55 & up for both men and women.
What do you see?


What I liked about these charts:
A. The five individual series on each chart are clearly separatable and easy to understand
B. The trends for for 16-24 and 55 & up stand out clearly and provide a spur for further thought and investigation
C. The multi-dimensionality of the three charts presented all at the same time in close proximity to each other in the original post. This is an excellent example of the possible explanatory power that can be achieved through disaggregation.
D. The use of a long 32 year interval helps to give a full sweep to the trends at work for these factors
E. Dave Altig's discussion in his post of what he was seeing and his links to other sources and opinions stimulates further conversation and discussion.
What else would I like to do with this same data
If the 15 data series used to generate these three charts had been readily and directly available as a single, easy to use data set linked to the blog entry, here are some things I might have wanted to do with that data and actually had the chance to do given available time constraints.
F. Zoomed in on the interval from 1995 to 2005, or 2000 to 2005 for a closer look at the patterns at work. While the oldest and youngest age cohorts show clear patterns in the original chart, there may be forces at work in the other age groups that would become visible when we zoom in.
G. For the same reason, I would want to sequence through all 15 metrics one at a time for these shorter but still substantial intervals so that further subtle patterns could be coaxed to the surface. I would use a Y Axis scaling from the Minimum to the Maximum for that particular age and gender group to make this as easy to see as possible.
H. As I zoomed in and adjusted the Y Axis, I might also want to apply some form of smoothing if the data patterns became more erratic. I might want to replace the labor force percentage by the year over year change in labor force percentage for each factor and then possibly smooth the result again with a moving average.
I. I would want to add in some more factors and look at these individually
---1 Labor Force Participation Percentage for everyone
---2 Labor Force Participation for all Male and for all Female
---3 Labor Force Participation for 25-54 (all, male, female)
---4 Labor Force Participation for 55-64
---5 Labor Force Participation for 65 & up
J. Some further metrics showing how the population demographics of these groups are shifting year by year would also be helpful for further analysis.
K. For the group from 16-24, some further metrics showing school attendance at the high school and college level would likely help add some explanatory value. Some poverty metrics for this group would add further to the picture.
L. For the 55 & up group, factors showing participation in drawing Social Security benefits, poverty data, and data showing 401K withdrawals would add even more to the mix.
I recognize that all the Labor Force Participation metrics are in fact available from the BLS and I will be grabbing some of these as I work out the promised multi-dimensional, multi-time-interval example of Employment Situation over the next few weeks. My comments here are simply meant to indicate that if I could have grabbed the full 15 metric data set, I might have done some of that kind of work as part of this post today, much as I did with the BLS MLR Editor's desk data in a post earlier today on CPI and PPI.
No comments:
Post a Comment