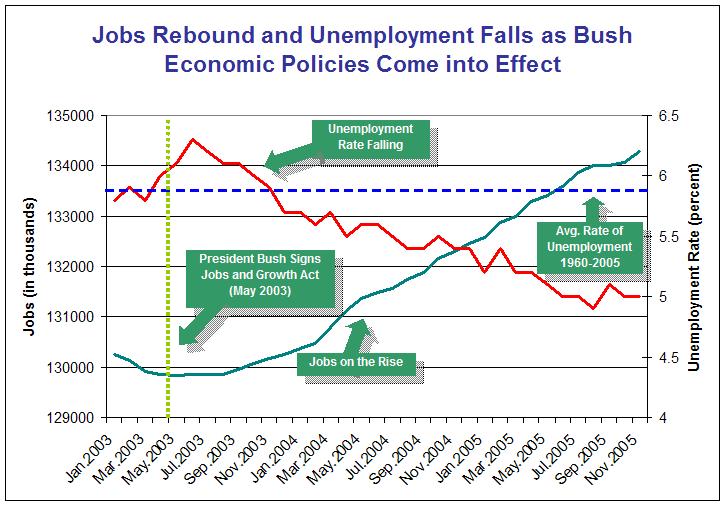
This is a nice example of cherry picking from a recent US Treasury Department press release. (Click for larger image) . In this case, the selection of the starting date, the scaling for the Y axes, and a pair of cooperating factors creates a strong impression of an economy that is going gangbusters and directly helping the ordinary working person.
Contrast this with the EPI talking points that we mentioned in our previous post that highlight a fairly lengthy list of the less than rosy things happening in the lives of American workers.
Picking a starting date near the peak for unemployment percent and near the low point for total jobs creates a different impression than if these same two factors had been viewed since 2000 or 1995 or 1990 or 1980. If you want to understand what's is happening with these two important metrics and to think about what it might mean, these other starting times will surely be instructive to your deliberations.
There is more going on here than just cherry picking. There is a strong push in this graphic to imply that there is powerful cause and effect relationship at work that is driving these numbers. Notice the vertical dotted yellow line for May 2003, the Green Text Box telling us "President Bush Signs Jobs and Growth Act (May 2003)", and the title linking the changes in these two factors to this specific President Bush action. Perhaps there is some relationship between that action and the visible results, but there is nothing in the graph or in the accompanying text of this press release that sheds light on how these two are in fact linked. The text box could equally well have said "Mission Accomplished (May 2003)".
Finally, the dotted blue line showing the average unemployment percentage from 1960-2005 is a great example of inappropriate use of averages and involves cherry picking of the starting and ending date. A very different blue line would have resulted from using the average unemployment from 1995-2000.
How can you protect yourself from Extremes of Cherry Picking? Here is how I would appraoch it.
a) look at the entire data time series yourself for each important factor - going back to at least 1980 in this case
b) zoom in and out on different time periods to grasp a fuller sense of the trends at work - include 1980-2005, 1990 through 2005, 1995 through 2005, 2000 through 2005
c) look at all the important factors - not just the ones that support your theory - in this case, the EPI datazone referenced in the previous post could be a good place to start. Once you have looked at this rather large set of factors, take a step back and think if there are any other factors that may have been left out.
d) adjust scaling as needed
e) look at different combinations of variables together
f) if you want to link the timing of specific events (e.g. the impact of Hurricane Katrina) or actions to what you see in the trends, create a list of the ones you think are most relevant.
g) try comparing different time periods - e.g. 1995 to 2000 compared to 2000-2005 with the factors that you consider the most important.
No comments:
Post a Comment