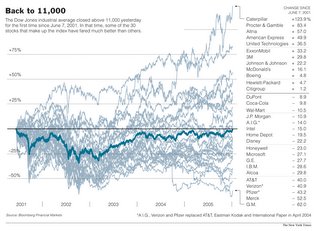
 In the recent New York Times article,
Dow Tops 11,000; First Time Since '01 - New York Times, they show the progress of the DOW over the past 5 years while superimposing the behavior of its component parts.
It's a nice example, of why it is some important to look beneath the covers of Headline Indicators like the Dow and disaggregate its behavior into its component parts.
It would be nice to have an easy way to change the time frame or to select just the 3 or 4 top stocks for the period, or the 3 or 4 worst performing stocks.
No comments:
Post a Comment