Apprenticed Investor: Know Thyself
Hat tip to Brad Delong for pointing out and reminding me of this excellent article by Barry Ritholtz in his Apprenticed Investor. While Barry is directing his comments at our all too human behaviors when we are investing in stocks, his discussion of pitfalls to watch out for is highly relevant to the analysis of any set of complex data (e.g. the 142 Iraq factors we have so far identified).
Take a look. It's a quick read and well worth the effort
Wednesday, January 24, 2007
Top 12 factors (one citizen's view)
Here's an even shorter list of what I consider to be the top 12 factors to watch right now.
This does not mean that we should only look at this subset. In my opinion, every item on the previous post's list of 34 is of high importance and worthy of being measured, tracked, and reported consistently in near real time.
In fact, while perhaps of not as high importance (and opinions will of course vary on this), almost every item on the list of 142 deserves regular attention - measurement, tracking, and reporting - so that the full picture can be brought into view.
From the Brookings Iraq Index Report
- Iraqi Deaths from All Violent Causes
- Crude oil production
- US Soldiers Killed with moving avg & event timing - March 2003 - December 30, 2006
- US Soldiers Wounded with moving avg - Sept 6, 2003 - Dec 29, 2006
- Daily Average of Inter-ethnic Attacks
- Avg Hours/Day of Power Baghdad (prewar 20)
- Unemployment Rate (%)
- Rate of Jobs Creation
- Iraqis Kidnapped in Baghdad (table page 15)
- Number of total daily patrols (chart page 23)
- People with potable water (table page 42)
- Percentage of Iraqis who strongly oppose presence of Coalition troops (table page 51)
First cut at identifying most important factors
Here's one private citizen's view on which of the 142 Iraq factors identified so far are most vital to understanding what is happening on the ground in Iraq. These are the ones that I believed need to be measured and reported on regularly so we can see the trends at work. I have picked 34 out of 142 (or about 24% of the total) so this is something like an 80/20 selection.
What does your list look like?
It would be excellent to see Michael O'Hanlon's list, or Anthony Cordesman's list, or Secretary Gate's list, or Secretary Rice's list, or Lt. Gen. Petraeus' list of the top factors they will be considering as we go forward.
From the Brookings Iraq Index Report
What does your list look like?
It would be excellent to see Michael O'Hanlon's list, or Anthony Cordesman's list, or Secretary Gate's list, or Secretary Rice's list, or Lt. Gen. Petraeus' list of the top factors they will be considering as we go forward.
From the Brookings Iraq Index Report
- Average Weekly Attacks by Time Period – 01 Jan 2004 – 11 Aug 2005
- Iraqi Deaths from All Violent Causes – Jan 06- Oct 06
- Enemy-Initiated Attacks Against the Coalition and its Partners May 2003 –Aug 2006
- Crude oil production for the past 10 weeks.
- Electricity production compared to electricity demand since January 2004.
- US Soldiers Killed with moving avg & event timing - March 2003 - December 30, 2006
- US Soldiers Wounded with moving avg - Sept 6, 2003 - Dec 29, 2006
- Estimated Strength of Insurgency
- Estimated Strength of Shia Militias
- Daily Average of Inter-ethnic Attacks
- Iraqi Security Forces who are Politically Dependable
- Percent of Household Fuel Needs Available
- Avg Hours/Day of Power Baghdad (prewar 20)
- Unemployment Rate (%)
- total number of Iraqi Physicians who have murdered, kidnapped, or who have left Iraq.
- percent of coalition troops that are not US troops
- Percent of US troops killed by IEDs
- Year over year increase in Iraqi refugees
- Rate of Shia attacks on Sunnis
- Rate of Sunni attacks on Shia
- The number of children being immunized.
- Rate of Jobs Creation
- Degree of Overwork of our Soldiers and Marines
- Civilian deaths in Baghdad (page 12 table)
- Iraqis Kidnapped in Baghdad (table page 15)
- Iraqi prison population in US Custody (table page 16)
- Iraqi prison population in Iraqi Custody (table page 16)
- Number of total daily patrols (chart page 23)
- Gasoline/Benzene production (table page 29)
- Total cost of US operations (table page 37)
- People with potable water (table page 42)
- People with sewerage system coverage (table page 42)
- High School enrollment percentage (table page 43)
- Percentage of Iraqis who strongly oppose presence of Coalition troops (table page 51)
Combined Listing of Iraq Factors
Here's the combined list of 142 factors we have identified so far based on this series of recent posts. I have left off the links to the various sources. You can find them these links in the previous posts.
Which ones do you think are most vital to pay attention to on a regular, near-real-time basis in order to better understand what's happening on the ground?
How do you rank each on a scale of 1 to 10?
How often do you think each factor must be measured and reported?
Are there any ones you think can be dropped?
From the Brookings Iraq Index Report
- Multiple Fatality Bombings – May 03 – Jan 07
- Killed and Wounded in Multiple Fatality Bombings – May 03 – Jan 07
- Average Weekly Attacks by Time Period – 01 Jan 2004 – 11 Aug 2005
- Improvised Explosive Devices (IED’s) Detonated and Disarmed - Jan 2006 –June 2006
- US Troops Wounded in Action March - March 2003 – Jan 2007
- Iraqi Military and Police Killed Monthly – Apr 03 – Jan 07
- Iraqi Deaths from All Violet Causes – Jan 06- Oct 06
- Number of Daily Attacks by Insurgents and Militias - June 03 – Nov 06
- Enemy-Initiated Attacks Against the Coalition and its Partners May 2003 –Aug 2006
- Crude oil production for the past 10 weeks.
- Crude oil export since February 2006
- Electricity production compared to electricity demand since January 2004.
- The strength of the local Iraqi currency compared to the dollar
- US Ground troops in Iraq from March 2004 through December 2006
- Average daily casualties - Iraqi and Coalition from 01 April 2004 through 12 May 2006
- Average weekly attacks by time period 01 April 2004 through 12 May 2006
- US Soldiers Killed with moving avg & event timing - March 2003 - December 30, 2006
- US Soldiers Wounded with moving avg - Sept 6, 2003 - Dec 29, 2006
- IED Fatalities per month - July 2003 - January 2007
- Iraqi Police/Military fatalities - January 2005 - December 2006
- Iraqi Civilian fatalities - January 2005 - December 2006
- the monthly ratio of wounded to dead
- the monthly change in troop level in Iraq
- the monthly change in troop level in Iraq as a percent of the previous month's level
- the three month trailing moving average of fatalities
- the six month trailing moving average of fatalities
- the 9 month trailing moving average of fatalities
- the monthly total of wounded and dead combined
- US Troops in Iraq (thousands)
- Other Foreign Troops in Iraq (thousands)
- US Troops Killed
- US Troops Killed by IEDs
- US Troops Wounded
- Iraqi Army/Police Fatalities
- Iraqi Civilian Fatalities
- Multiple Fatality Bombings (for the month in question)
- Estimated Strength of Insurgency
- Estimated Strength of Shia Militias
- Daily Average of Inter-ethnic Attacks
- Estimated Number of Foreign Fighters
- Number of Daily Attacks by Insurgents/Militias
- Attacks on Oil/Gas Assets
- Iraqi Internally Displaced Since April 2003
- Iraqi Refugees Since April 2003 (Total)
- Iraqi Physicians Murdered or Kidnapped
- Iraqi Physicians who have Fled Iraq
- Iraqi Security Forces who are Technically Proficient
- Iraqi Security Forces who are Politically Dependable
- Oil Production (Millions of Barrels/Day prewar 2.5)
- Percent of Household Fuel Needs Available
- Electricity Production (in megawatts prewar 4000)
- Avg Hours/Day of Power Baghdad (prewar 20)
- Unemployment Rate (%)
- Per Capita GDP (Real Dollars prewar $900)
- Number of Trained Judges
- Telephone Subscribers (prewar 800000)
- Independent Media Companies (prewar 0)
- Iraqi Optimism (% who think things going in right direction)
- total number of Iraqi Physicians who have murdered, kidnapped, or who have left Iraq.
- percent of coalition troops that are not US troops
- Percent of US troops killed by IEDs
- Year over year increase in Iraqi refugees
- Good year/Bad Year (e.g. subjective on scale of 1 to 10)
- Sense of Progress (e.g. subjective on scale of 1 to 10)
- Al-Maliki Favorability Rating
- Al-Maliki Favorability Rating for all Sunni Arabs
- Rate of Shia attacks on Sunnis
- Rate of Sunni attacks on Shia
- Iraqi state subsidies for consumer goods
- The number of children being immunized.
- Percentage who feel safe en route to school
- Rate of private sector investment
- Slide toward chaos (e.g. subjective on scale of 1 to 10)
- Percent who think Economy is Poor
- Percent who think security environment is poor
- Rate of Jobs Creation
- Degree of Iraqi Leader consensus on sharing oil
- American support for the operation
- Number of coalition forces needed to provide security.
- Degree of Overwork of our Soldiers and Marines
- Rate of “Success of military commanders in putting Iraqis to work with their commander emergency response program funds”
- Degree of Support Iraqi Leaders enjoy outside their own sectarian group.
- Degree to which Iraqi Leaders are working across sectarian lines.
- The Probability that a Given Intervention will succeed (e.g the most recent set of changes in strategy and tactics)
- Degree of Pessimism
- Iraqis displaced per month
- Degree of Ethnic Cleansing
- Percentage of US troop fatalities caused by car bombs (page 3 table)
- Iraqi civilians killed by US troops (page 9 table)
- Police deaths in Baghdad (page 12 table)
- Civilian deaths in Baghdad (page 12 table)
- Kellogg, Brown and Root Employees in Iraq (table page 14)
- Combat arms troop strength (table page 14)
- Combat support troop strength (table page 14)
- Combat service support troop strength (table page 14)
- Dept of Defense Civilians in Iraq (table page 14)
- Total Civilian Personnel in Iraq & Kuwait (table page 14)
- Iraqis Kidnapped Nationwide (table page 15)
- Iraqis Kidnapped in Baghdad (table page 15)
- Iraqi prison population in US Custody (table page 16)
- Iraqi prison population in Iraqi Custody (table page 16)
- Active duty troop strength in Iraq (table page 20)
- Reserve & National Guard troop strength in Iraq (table page 20)
- Total US Army authorized strength - Activity duty (table page 20)
- Total US Army authorized strength - National Guard (table page 20)
- Total US Army authorized strength - Reserve (table page 20)
- Total US Army authorized strength - Combined Active, National Guard & Reserve (table page 20)
- Percentage of IEDs found and disarmed (table page 23)
- Number of daily Iraqi Patrols (chart page 23)
- Number of daily US Patrols (chart page 23)
- Number of daily Joint Iraqi-US Patrols (chart page 23)
- Number of total daily patrols (chart page 23)
- New passports issued (table page 24)
- Percent of professional class that has left since 2003 (table page 24)
- Iraqi refugees heading to Syria per day (table page 24)
- Iraqi refugees heading to Jordan per day (table page 24)
- US Air Strikes (Iraq only) (table page 26)
- C-130 Sorties flown (Iraq and Afghanistan combined) (table page 26)
- Diesel production (table page 29)
- Kerosene production (table page 29)
- Gasoline/Benzene production (table page 29)
- LPG production (table page 29)
- Non oil related GDP (table page 33)
- Total cost of US operations (table page 37)
- Cost of US defense activities (table page 37)
- Cost of Veteran's programs (table page 37)
- Inflation rate (table page 39)
- Cost of imported gasoline (table page 39)
- Domestic price of gasoline (table page 39)
- Relative amount of car traffic (table page 40)
- Typical waiting time for gasoline (table page 40)
- Number of registered cars (table page 40)
- Internet subscribers (table page 41)
- Tons of mail sent by Iraqis (table page 41)
- People with potable water (table page 42)
- People with sewerage system coverage (table page 42)
- Water treatment capacity (table page 42)
- Annual Iraqi Medical School Graduates (table page 42)
- Primary school enrollment percentage (table page 43)
- High School enrollment percentage (table page 43)
- Percentage of Iraqis who approve of attacks on US led forces (table page 44)
- Percentage of Iraqis who strongly oppose presence of Coalition troops (table page 51)
Tuesday, January 23, 2007
The Most Important Factors
Ooops. One critique I left off in the previous post is that to the best of my knowledge, none of the sources that I have consulted so far has laid out what they consider to be the most important of all the factors that they mention.
It is clear that huge amounts of data gathering, analysis, and reporting go into creating many of these reports which end up mentioning 50 or more factors.
From each of these sources, it would be most helpful to see a short list of the 20% of those factors that are considered most important by each analyst or group of analysts reporting on the subject.
I will take a cut myself at this particular challenge in the next post to show you what I mean.
Are we there yet?
How well does the current set of Iraq trend charts & tables serve our needs?
Answer: I think we are a little better off than we were 10 days ago when I began this series of posts on Iraq, but we certainly are not where we need to be. We can look at the charts that are currently available from multiple sources much more quickly now than we could before by skimming these two pdf files: Combine-Iraq-Trends and vizualizing-trends-ohanlon-testimony.pdf. But each of these documents has it's own and weaknesses as discussed below. And there are a growing number of important missing metrics that as yet have no publicly available trend chart or trend table.
What are the weaknesses of the Combine-Iraq-Trends document?
Answer: This combined report consisting of trend charts drawn from 4 different sources covers a lot of important ground and shares the trend behavior of many factors that appear quite important. On the downside, the big weaknesses of this set of trend charts are numerous:
What are the weaknesses of the Combine-Iraq-Trends document?
Answer:
What next steps could help things along and help us move closer to our goal of helping both ordinary citizens and decision makers gain a better understanding of the trends at work on the ground in Iraq?
Answer: We've made some progress, but in many ways we have only just begun. Below, I outline some steps I am planning to take with the goal of taking this up to the next level. If you can assist in any way, I would be pleased to hear from you.
Answer: I think we are a little better off than we were 10 days ago when I began this series of posts on Iraq, but we certainly are not where we need to be. We can look at the charts that are currently available from multiple sources much more quickly now than we could before by skimming these two pdf files: Combine-Iraq-Trends and vizualizing-trends-ohanlon-testimony.pdf. But each of these documents has it's own and weaknesses as discussed below. And there are a growing number of important missing metrics that as yet have no publicly available trend chart or trend table.
What are the weaknesses of the Combine-Iraq-Trends document?
Answer: This combined report consisting of trend charts drawn from 4 different sources covers a lot of important ground and shares the trend behavior of many factors that appear quite important. On the downside, the big weaknesses of this set of trend charts are numerous:
- There is a wide variation in formats - This reduces overall understandability and slows down the process of viewing the entire set of charts. Each chart must be examined individually with careful checks to make sure that the range of the X and Y axes are are clear and to locate the legend information that tells you what kind of factor you are looking at. This is in clear violation of the Edward Tufte's idea of small multiples that we discussed in a previous post. Applying small multiple thinking to a set of trend charts means that for the viewer, once understanding is reached regarding how a single chart in a series is laid out and what graphing conventions have been used, succeeding charts can be grasped with much reduced time and effort.
- Time frames of the individual charts are widely different. Some cover the period from the start of the War in 2003 right up to the present moment. Others, cover much shorter periods. For example, the IED chart covers only from January 2006-June 2006. Some charts show monthly data, others show weekly data. This is another violation of the small multiple idea and the consequence for the viewer is that it is more difficult and more time-consuming to make any comparisons between different factors.
- Stale Data: Violation of the "Near Real Time" Principle In many charts such as the IED chart mentioned above, the most recent sample is many, many months ago. If something is rated as an important factor, then it won't do us any good unless we measure and report on it often and that we make the most recent sample data available as quickly as possible. A 7 month old data point of a key trend factor can substantially frustrate our ability to understand what's going on, to determine whether interventions we have taken are working, or to decide what to do next.
- Overly short time frames. Charts such as the State Dept's Crude Oil Production chart cover an amazingly short time frame - in this case from October 30th, 2006 to January 7th, 2007. While this chart is both interesting, useful, and clear, the viewer is seriously short-changed by not being able to look at what has happened to this key trend factor for the entire period since the war began.
- Unavailability of the Underlying Data. In many cases with these charts, the underlying trend data is unavailable for further review or analysis. This means that the viewer of the chart is sharply impeded from discovering different angles to examine the data (e.g. by combining several factors together in a single chart, or calculating new previously invisible factors as a combination of an original set of factors.) If the original analyst who selected the chart for presentation did not create one chart for each important view, then without the data, these new views are simply unattainable. And of course, it's never possible for the original analyst to provide all the views.
- Data that is provided is Not Readily Reusable (RR). In the relatively small number of cases where the raw trend data is provided, it is painful and time-consuming to transform these data into an RR format. This slows down the effort of understanding and because of the time involved, only a small percentage of potentially interested parties ever actually make these transformations.
- Missing Metrics, Quality of Metrics. Many of these sources mention other metrics specifically (presumably because they are considered important) but do not provide trend tables or charts. And all metrics, those that are charted and those that are not, must be evaluated against the quality criteria outlined by Anthony Cordesman as noted in
The Quarterly Report on “Measuring Stability and Security in Iraq:” Fact, Fallacy, and an Overall Grade of “F”
What are the weaknesses of the Combine-Iraq-Trends document?
Answer:
- Stale Data: Violation of the "Near Real Time" Principle - the most recent data point in all of these charts is November 2006 so the trend series displayed is not as up to date (on January 10th when this data was presented) as one might wish.
- Overly long time frame between samples. Way too few samples. Having a total four samples, one year apart creates a trend table that is quite readable on an 8 by 11 sheet of paper. The price is dramatic loss of vital detail and can lead to seriously misleading conclusions.
- Data that was originally provided was Not Readily Reusable (RR). We were able to work our way around this barrier and create trend charts from the data, but it was costly in time and will serve as an impediment to further analysis of the data for most people most of the time.
- Missing Metrics, As we noted in an earlier post, there were many Iraq trend factors that Michael O'Hanlon considered important enough to include is his verbal testimony and in the logic of thinking through what those factors meant, but which did not appear in the attached table of 30 factors. Our view is that if a metric is important enough to mention and use for logical argument, it is imperative that the details of how that factor varies over time are provided for further review and analysis by interested parties.
- Quality of Metrics. As for the case of evaluating the Combine-Iraq-Trends document, all metrics, those that are in the table (and therefore charted) and those that are in the text must be evaluated against the quality criteria outlined by Anthony Cordesman as noted in:
The Quarterly Report on “Measuring Stability and Security in Iraq:” Fact, Fallacy, and an Overall Grade of “F”How
What next steps could help things along and help us move closer to our goal of helping both ordinary citizens and decision makers gain a better understanding of the trends at work on the ground in Iraq?
Answer: We've made some progress, but in many ways we have only just begun. Below, I outline some steps I am planning to take with the goal of taking this up to the next level. If you can assist in any way, I would be pleased to hear from you.
- Continue to harvest and grow our list of missing metrics and invisible indicators, for example by close examination of Dept of Defense quarterly report or the many writings of Anthony Cordesman on the subject.
- Create a single composite list of all the factors for which we do not yet have trend data or trend charts but which we think would further aid our understanding if they were to be made available.
- Make inquiries to the original sources to see if the raw trend data for the key factors that have been identified can be made available for further use, ideally in a readily-reusable form to begin with.
Further Sources of Vital Iraq Trend Data
Thanks to a hat tip from a reader, here are a few more sources of vital online information about Iraq trend data that have recently come to my attention and that I find most relevant to the ongoing discussion.
First, there is the Dept. of Defense's quarterly report to Congress about the status in Iraq - Measuring Security and Stability in Iraq. The most recent report is dated November 2006. The report includes 9 trend charts and 1 trend table. Some of these charts are variants of trend charts we have already seen from our look at the Brookings Iraq Index , Michael O'Hanlon's testimony, GlobalSecurity and the Iraq Casualty Coalition . Others, however, are new and complementary to the charts we have seen so far. For example, there is a single chart combining three separate trends (average daily casualties for Iraqi Civilians, Iraqi Security Forces and Coalition Forces) and there is another chart showing "Ethno-Sectarian Incidents and Executions".
I have not yet had the chance yet to study the most recent Dept of Defense Quarterly Report in depth. My initial scan indicates that it includes mention of dozens of other important factors whose trend patterns might help us better understand the situation on the ground, but for which no trend data or trend graphics are presented. Among these missing metrics or what might also be called "invisible indicators" or "faceless factors" are many new metrics that are not included even in our list of more than 100 metrics that we have already mentioned in this series of posts. We have it on our to do list to see if in the next couple of weeks we can bubble up these missing metrics to add to our growing list.
Second, there is a powerful, provocative and quite critical report by Anthony Cordesman analyzing the Dept of Defense's Quarterly Measuring Security and Stability in Iraq report that the DoD issued in May 2006: The Quarterly Report on “Measuring Stability and Security in Iraq:” Fact, Fallacy, and an Overall Grade of “F”
Here's a brief quote from the introduction [emphasis added]:
In my view Anthony Cordesman brings a level of rigor to this particular report that is lacking from the other sources we have so far examined and his approach would be well worth emulating going forward.
In the meantime, just because there are questions about the quality of many of the individual data factors, that doesn't mean we should stop doing what we've been doing. This does not mean that we should stop measuring and or that we should stop regularly updating our trend tables and trend charts or that we should stop searching for missing metrics and adding them to our list.
In fact, I think you will find that it is true that by being able examine many trend factors in a time efficient manner provides powerful checks and balances that can help us discover which factors may be most likely to suffer from quality problems.
If you know of other sources of vital Iraq trend data that we are missing, please let us know.
First, there is the Dept. of Defense's quarterly report to Congress about the status in Iraq - Measuring Security and Stability in Iraq. The most recent report is dated November 2006. The report includes 9 trend charts and 1 trend table. Some of these charts are variants of trend charts we have already seen from our look at the Brookings Iraq Index , Michael O'Hanlon's testimony, GlobalSecurity and the Iraq Casualty Coalition . Others, however, are new and complementary to the charts we have seen so far. For example, there is a single chart combining three separate trends (average daily casualties for Iraqi Civilians, Iraqi Security Forces and Coalition Forces) and there is another chart showing "Ethno-Sectarian Incidents and Executions".
I have not yet had the chance yet to study the most recent Dept of Defense Quarterly Report in depth. My initial scan indicates that it includes mention of dozens of other important factors whose trend patterns might help us better understand the situation on the ground, but for which no trend data or trend graphics are presented. Among these missing metrics or what might also be called "invisible indicators" or "faceless factors" are many new metrics that are not included even in our list of more than 100 metrics that we have already mentioned in this series of posts. We have it on our to do list to see if in the next couple of weeks we can bubble up these missing metrics to add to our growing list.
Second, there is a powerful, provocative and quite critical report by Anthony Cordesman analyzing the Dept of Defense's Quarterly Measuring Security and Stability in Iraq report that the DoD issued in May 2006: The Quarterly Report on “Measuring Stability and Security in Iraq:” Fact, Fallacy, and an Overall Grade of “F”
Here's a brief quote from the introduction [emphasis added]:
The media can provide some of this picture, as can outside experts and scholars, but only the US government has the resources and access to information that provide a comprehensive overview of the situation. The quarterly report to Congress issued by the Department of Defense, “Measuring Stability and Security in Iraq,” is supposed to be a key document to achieve this goal.This entire report is well worth reading. It focuses on the reliability and validity of the trend data we are getting - a topic that we have not yet touched on in this report but which is of course highly relevant to everything we are looking at. It would be extremely valuable to repeat this kind of evaluation of the quality of data sources with the latest DoD quarterly report, with the weekly State Dept report, with the Brookings Iraq Index and with ALL the factors that we rate as important and relevant to understanding the situation on the ground in Iraq.
Like the State Department weekly status report on Iraq, however, it is deeply flawed. It does more than simply spin the situation to provide false assurances. It makes basic analytical and statistical mistakes, fails to define key terms, provides undefined and unverifiable survey information, and deals with key issues by omission.
In my view Anthony Cordesman brings a level of rigor to this particular report that is lacking from the other sources we have so far examined and his approach would be well worth emulating going forward.
In the meantime, just because there are questions about the quality of many of the individual data factors, that doesn't mean we should stop doing what we've been doing. This does not mean that we should stop measuring and or that we should stop regularly updating our trend tables and trend charts or that we should stop searching for missing metrics and adding them to our list.
In fact, I think you will find that it is true that by being able examine many trend factors in a time efficient manner provides powerful checks and balances that can help us discover which factors may be most likely to suffer from quality problems.
If you know of other sources of vital Iraq trend data that we are missing, please let us know.
Sunday, January 21, 2007
Taking Stock of the Recent Iraq Trends Posts: A demonstration of future possibilities
So far in our recent series of posts on trends on the ground in Iraq, we have created a number of trend data files (Iraq-RR-Example.csv and ohanlon-key-factors.csv) and trend visualization documents (Combine-Iraq-Trends and vizualizing-trends-ohanlon-testimony.pdf) that we hope have helped make the situation in Iraq more understandable, more quickly, to a wider number of individual citizens. If you want a quick refresher of how easy it is to look at more than 50 important trends in Iraq, just download the two pdf documents noted above and see what you think.
We believe that this approach results in radical time savings and increased in depth and breadth of coverage and therefore understanding.
We also hope that by taking these steps and preparing this demonstration of what other new and creative things might be done with the available trend data that this work will benefit even the key decision makers who are directly or indirectly involved in the day to day situation in Iraq and even those who are regularly spending a substantial portion of their time looking at and interpreting trend data.
We would enjoy hearing your comment and feedback on whether you think this demonstration of the possibilities represents a path worth pursuing further.
Here's a more detailed summary of what we have covered and accomplished so far in this series of posts that we began on January 13th.
With so many factors to consider, you might feel this is daunting. In upcoming posts we will directly address any fears you might have that handling 100 or more factors might be too difficult or beyond your reach and show you how the approach of using Readily Reusable data combined with time saving tools of which TLViz and CSVPNG are useful models can save the day.
We will also be taking a look at what we might do next to make the trend data coming out of Iraq even more useful and valuable for both ordinary citizens and for decision makers.
We believe that this approach results in radical time savings and increased in depth and breadth of coverage and therefore understanding.
We also hope that by taking these steps and preparing this demonstration of what other new and creative things might be done with the available trend data that this work will benefit even the key decision makers who are directly or indirectly involved in the day to day situation in Iraq and even those who are regularly spending a substantial portion of their time looking at and interpreting trend data.
We would enjoy hearing your comment and feedback on whether you think this demonstration of the possibilities represents a path worth pursuing further.
Here's a more detailed summary of what we have covered and accomplished so far in this series of posts that we began on January 13th.
- we pulled together a series of charts about key trends in Iraq drawn from several important source documents and web sites and we have made this whole set of charts more readily viewable by assembling them into a single downloadable pdf document - Combine-Iraq-Trends.
- In this January 18th post we showed how we could combine raw tabular trend data from several different sources and paste it into a single readily-reusable (RR) csv file. This meant we could then easily calculate and visualize some new, important, and previously invisible trends such as the wounded to killed ratio or the three month moving average for troop fatalities and we could save the original combined trend data with the new calculated trend factors together in a single csv file: Iraq-RR-Example.csv that others could then examine and use directly.
- We then took a more elaborate case and showed how straightforward it was to transform a table of 30 key factors from Michael O'Hanlon's testimony into a readily reusable trend data file - ohanlon-key-factors.csv. - and then use that file to generate a series of easily viewable trend charts - vizualizing-trends-ohanlon-testimony.pdf.
- And finally, in our most recent posts, we demonstrated that even though we had already pulled together and presented more than 50 different trend charts, that there were still rather important factors, whose trends we had not yet looked at. In this post yesterday, we listed more than 20 important factors that were mentioned as part of the verbal argument presented by Michael O'Hanlon in his testimony, but which did not show up in his table of trend factors. And in our most recent post today, we showed how a close reading of the Brookings Iraq Index allowed us to discover more than 50 important additional factors that could help us imagine a fuller picture of what is going on in Iraq.
With so many factors to consider, you might feel this is daunting. In upcoming posts we will directly address any fears you might have that handling 100 or more factors might be too difficult or beyond your reach and show you how the approach of using Readily Reusable data combined with time saving tools of which TLViz and CSVPNG are useful models can save the day.
We will also be taking a look at what we might do next to make the trend data coming out of Iraq even more useful and valuable for both ordinary citizens and for decision makers.
More Invisible Metrics: What other trends is it vital that we make readily resuable and visualizable
So far in this series of posts about better understanding the situation on the ground in Iraq, we have focused on bringing together important trends and presenting them graphically in ways aimed at making this vital information more readily available and usable to both decision makers and to ordinary citizens.
Our short term goal has been to radically reduce each viewer's cost in time spent (compared to previous formulations) while at the same time sharply increasing the depth and breadth of understanding attained.
Our longer term goal is for this increased level of understanding (now achievable and within reach of a much larger number of individuals) to be the catalyst that spurs better discussion, improved collaboration, and much deeper thinking about what is really going on, what it means, and what actions might lead to improved results in the future.
In our next post, we will give a wrap up the ground we have covered so far in this series. For now, we have some unfinished business, namely that there are many other vital Iraq trend factors that are necessary for our more complete understanding of the situation. So continuing with the list of missing factors from our previous post, below we highlight an additional 55 factors that we discovered and selected through a close reading of the Brookings Iraq Index.
In our opinion, being able to see the trend graph for each of these would add to our overall understanding of what is going on in Iraq. Admittedly, not all of these are of equal importance but the trend for each is likely to have an important story to tell if we assemble the necessary trend data and then create the chart.
Our list of important metrics is getting longer and longer. But this is not all there is.
What other factors do you think are important? What else is missing? What else would you like to know? What else would you like to see? Do any of these factors trigger ideas about other important factors that were not even mentioned at all? Do combination of factors come to mind for you that you think would shed even more light?
And finally, of the 100 or more factors that we have touched on in this series of posts, what is your short list of the top 10 or 20 most important ones?
Our short term goal has been to radically reduce each viewer's cost in time spent (compared to previous formulations) while at the same time sharply increasing the depth and breadth of understanding attained.
Our longer term goal is for this increased level of understanding (now achievable and within reach of a much larger number of individuals) to be the catalyst that spurs better discussion, improved collaboration, and much deeper thinking about what is really going on, what it means, and what actions might lead to improved results in the future.
In our next post, we will give a wrap up the ground we have covered so far in this series. For now, we have some unfinished business, namely that there are many other vital Iraq trend factors that are necessary for our more complete understanding of the situation. So continuing with the list of missing factors from our previous post, below we highlight an additional 55 factors that we discovered and selected through a close reading of the Brookings Iraq Index.
In our opinion, being able to see the trend graph for each of these would add to our overall understanding of what is going on in Iraq. Admittedly, not all of these are of equal importance but the trend for each is likely to have an important story to tell if we assemble the necessary trend data and then create the chart.
- Percentage of US troop fatalities caused by car bombs (page 3 table)
- Iraqi civilians killed by US troops (page 9 table)
- Police deaths in Baghdad (page 12 table)
- Civilian deaths in Baghdad (page 12 table)
- Kellogg, Brown and Root Employees in Iraq (table page 14)
- Combat arms troop strength (table page 14)
- Combat support troop strength (table page 14)
- Combat service support troop strength (table page 14)
- Dept of Defense Civilians in Iraq (table page 14)
- Total Civilian Personnel in Iraq & Kuwait (table page 14)
- Iraqis Kidnapped Nationwide (table page 15)
- Iraqis Kidnapped in Baghdad (table page 15)
- Iraqi prison population in US Custody (table page 16)
- Iraqi prison population in Iraqi Custody (table page 16)
- Active duty troop strength in Iraq (table page 20)
- Reserve & National Guard troop strength in Iraq (table page 20)
- Total US Army authorized strength - Activity duty (table page 20)
- Total US Army authorized strength - National Guard (table page 20)
- Total US Army authorized strength - Reserve (table page 20)
- Total US Army authorized strength - Combined Active, National Guard & Reserve (table page 20)
- Percentage of IEDs found and disarmed (table page 23)
- Number of daily Iraqi Patrols (chart page 23)
- Number of daily US Patrols (chart page 23)
- Number of daily Joint Iraqi-US Patrols (chart page 23)
- Number of total daily patrols (chart page 23)
- New passports issued (table page 24)
- Percent of professional class that has left since 2003 (table page 24)
- Iraqi refugees heading to Syria per day (table page 24)
- Iraqi refugees heading to Jordan per day (table page 24)
- US Air Strikes (Iraq only) (table page 26)
- C-130 Sorties flown (Iraq and Afghanistan combined) (table page 26)
- Diesel production (table page 29)
- Kerosene production (table page 29)
- Gasoline/Benzene production (table page 29)
- LPG production (table page 29)
- Non oil related GDP (table page 33)
- Total cost of US operations (table page 37)
- Cost of US defense activitites (table page 37)
- Cost of Veteran's programs (table page 37)
- Inflation rate (table page 39)
- Cost of imported gasoline (table page 39)
- Domestic price of gasoline (table page 39)
- Relative amount of car traffic (table page 40)
- Typical waiting time for gasoline (table page 40)
- Number of registered cars (table page 40)
- Internet subscribers (table page 41)
- Tons of mail sent by Iraqis (table page 41)
- People with potable water (table page 42)
- People with sewerage system coverage (table page 42)
- Water treatment capacity (table page 42)
- Annual Iraqi Medical School Graduates (table page 42)
- Primary school enrollment percentage (table page 43)
- High School enrollment percentage (table page 43)
- Percentage of Iraqis who approve of attacks on US led forces (table page 44)
- Percentage of Iraqis who strongly oppose presence of Coalition troops (table page 51)
Our list of important metrics is getting longer and longer. But this is not all there is.
What other factors do you think are important? What else is missing? What else would you like to know? What else would you like to see? Do any of these factors trigger ideas about other important factors that were not even mentioned at all? Do combination of factors come to mind for you that you think would shed even more light?
And finally, of the 100 or more factors that we have touched on in this series of posts, what is your short list of the top 10 or 20 most important ones?
Saturday, January 20, 2007
Missing Metrics - What else do we need to know about how things are going in Iraq?
In looking closely at the text of Michael O'Hanlon's testimony to the Senate Foreign Relations Committee on January 10th, 2007, I noticed that he spoke of quite a few Iraqi factors on the ground that were NOT included in the list of 30 metrics reported.
A small number of the factors that showed up in the tabular data were mentioned in the logic of the text, but I was surprised by how many important factors from the text had no numerical equivalent in the table.
Here's a list of the missing factors that I found in the text with my comments in brackets.
Bottom Line: If we want to understand what's going on in Iraq, we are going to have to work harder at bringing these missing metrics out in the open where every citizen can see them, think about them, discuss them.
A small number of the factors that showed up in the tabular data were mentioned in the logic of the text, but I was surprised by how many important factors from the text had no numerical equivalent in the table.
Here's a list of the missing factors that I found in the text with my comments in brackets.
Good year/Bad Year - <I would love to know more about what key factors Michael incorporates in his thinking in coming up with this assessment and would find it enlightening if this black and white measurement were refined and reported on say a scale from 1 to 10 or 1 to 100>
“The year 2006 was, tragically and inescapably, a bad one in
Sense of Progress
“The first is the failure of the 2005 election process to produce any sense of progress.”
Al-Maliki Favorabaility Rating
“In a September poll, Prime Minister al-Maliki was viewed unfavorably by 85 percent of all Sunni Arabs”
Rate of Shia attacks on Sunnis
Rate of Sunni attacks on Shia
Increasing politicization of the violence “to include many more Shia attacks on Sunnis as well as the reverse”
Iraqi state subsidies for consumer goods
“recent reductions in Iraqi state subsidies for consumer goods (which distort the economy and divert government resources)”,
The number of children being immunized.
Percentage who feel safe en route to school
Rate of private sector investment
“further slide toward chaos.”
Percent who think Economy is Poor
According to a June, 2006 poll, 59 percent call the economy poor
Percent who think security environment is poor
“and 75 percent describe the security environment as poor”.
Rate of Jobs Creation
“a massive program to create jobs”
Degree of Iraqi Leader consensus on sharing oil
“an ultimatum to Iraqi political leaders that if they fail to achieve consensus on key issues like sharing oil”,
“American support for the operation
could very soon decline”
Number of coalition forces needed to provide security.
“Coalition forces have never reached the numbers needed to provide security for the population in
Degree of Overwork of our Soldiers and Marines
“our already overworked soldiers and Marines”.
Rate of “Success of military commanders in putting Iraqis to work
with their commander emergency response program funds”,
Degree of Support Iraqi Leaders enjoy outside their own sectarian group.
“it is clear that extremely few Iraqi leaders enjoy any real support outside of their own sectarian group.”
Degree to which Iraqi Leaders are working across sectarian lines.
“Trying to force them to work across sectarian lines must be a focus of our policy efforts, if there is to be any hope of ultimate stability in
The Probability that a Given Intervention will succeed
“Social scientists and military experts do not know how to assess rigorously the probabilities that such steps will succeed at this late hour in
Degree of Pessimism
“Overall, however, it seems fair to say that most have become quite pessimistic.”
Iraqis displaced per month
“But with 100,000 Iraqis per month being displaced from their homes, making for a total of some two million since Saddam was overthrown, ethnic cleansing is already happening.”
Bottom Line: If we want to understand what's going on in Iraq, we are going to have to work harder at bringing these missing metrics out in the open where every citizen can see them, think about them, discuss them.
Tapping the Power of Iraq Readily Reusable Data
In the previous post, we showed how the tabular data from Michael O'Hanlon's testimony to the Senate Foreign Relations Committee could be converted to a Readily Reusable (RR) format as a CSV file ( ohanlon-key-factors.csv ) and how the RR format then made it relatively straightforward and inexpensive to actually look at the visualization of all thirty of the reported trends, one by one as shown in vizualizing-trends-ohanlon-testimony.pdf.
We have found that when using RR data and TLViz, the time savings we achieve make it possible to look at hundreds of trends, one after the other, in a very short time so as to gain a gestalt sense of all the reported factors at work. Typically, moving from tabular form to RR form gives a productivity saving factor of at least 10 to 1. Frequently, the productivity increase is 50 to 1 or more.
After having reviewed each of the 30 reported trend factors from Michael O'Hanlon's testimony, it became apparent that there were some other interesting trends hiding amongst the original data that could be computed with simple calculations from the original data. This is readily achievable by opening the RR csv file with a tool such as Microsoft Excel.
For example, with Excel we could create a new column of data and combine US troop strength and troop strength of other non-US coalition forces and then calculate the percentage of coalitions forces that were non-US. Similarly, we could use the original data to calculate the percentage of US troops that had been killed in that month by IEDs. We could also take factors such as the cumulative number of refugees and convert them into year over year trend data.
Below, we show you the three new trend charts that bring some previously invisible trends into the light of day where we can all see them. (please click on trend graphic for full size image.)


Bottom line. Once the trend data is in RR format, all sorts of new possibilities of understanding open up that can help us better understand what is really going on.
Friday, January 19, 2007
Visualizing the O'Hanlon Trend Data
Once we had the the data from Michael O'Hanlon's Senate Foreign Relations Committee Testimony (Jan 10, 2007) in readily reusable (RR) form, we opened that csv file with TLViz and were able to generate a set of graphs in a matter of minutes showing the individual trends in visual form including some that combined several of the metrics together.
You can see a pdf slide show of the entire set of charts we created in full screen size by clicking on: vizualizing-trends-ohanlon-testimony.pdf
Using Edward Tufte's idea of small multiples, we have combined 4 trends at a time into the pictures below (please click for full size) that show a sample of the charts from the full report.
The first 4 show US troops killed by IED, Iraq Civilian Fatalities, Multiple Fatality Bombings, and Estimated Strength of the Insurgency.

The next 4 trends show Estimated Strength of Shia Militias, Daily Average of Inter-ethnic attacks, Estimated Number of Foreign Fighters, and Number of Daily Attacks by Insurgents or Militias.

The next four small multiples show Iraqi Internally Displace, Iraq Refugees, Iraqi Physicians Murdered or Kidnapped, and Iraqi Physicians who have fled Iraq.

In this next set of trends, the first chart shows the total number of Iraqi Physicians who have murdered, kidnapped, or who have left Iraq. This chart was created by combining two of the originally reported trends. The second chart also combines two original trends, this time comparing the number of Iraqi forces who are technically proficient to the number who are politically dependable. The final two charts in the small multiple set show the Percentage of Household Fuel needs that are being met and the average hours per day of electricity in Baghdad.

This final small multiple set shows the Unemployment Rate, the Per Capita GDP, the Number of Trained Judges, and the Number of Telephone Subscribers.

If you click on these charts and then press F11, you should have a full screen readable version to examine. Of course, if you want to look at each chart by itself in full screen size with easy back and forth navigation, the vizualizing-trends-ohanlon-testimony.pdf is the place to go.
One of the advantages of these charts to the previous set of combined charts that we published is that they all cover the same time period and that makes understanding what they mean just that much easier. Once you understand what the X axis timeline means in one chart, you don't have to recompute that with each chart you examine.
Once again, we suggest that you download this RR data yourself and play with it to see what else you can find, what other patterns are hiding in the data. You can download by right clicking on ohanlon-key-factors.csv. We also suggest that this could be a fine opportunity for you to test out the ways in which TLViz simplifies and speeds up trend analysis work once you have RR data. You can learn more about TLViz from our earlier posts this month and you can download a copy of the full kit for Windows PC's from TrendsThatMatter's Download Page
Iraq Trend Data: O'Hanlon's Testimony to the Foreign Relations Committee
Michael O'Hanlon who is the lead author of the Brookings Iraq Index testified last week before the Senate Foreign Relations Committee. Here's the 4 page text of his January 10th testimony.
The last two pages show a relatively easy to read and understand printed table. The table lists, all in one place, what I assume to be what O'Hanlon thinks are the 30 key factors on the ground in Iraq and how they have varied year by year from November 2003 to November 2006.
Here's a version of that table that I have edited for even better visibility and to keep it from covering two pages. (please click on image for full size view):
 The four data columns of the table show the trends for those factors with the data values being captured for the month of November in each of the past 4 years. From a standpoint of printed table readability, limiting the number of trend samples to 4 makes this table much more suited for direct human consumption at the cost of reducing overall trend data quality compared to a set of trend samples for a given factor that showed how that factor changes every month.
While most people are not comfortable with reading tables, this one is actually readable and understandable with the application of a modest amount of effort. Please let us know what you think?
This table as text is of course not a readily-reusable (RR) file. However, it was relatively straightforward for us to convert it into RR format and you can download your own copy by right clicking on ohanlon-key-factors.csv. This RR file is ready for examination with Microsoft Excel or even better with the T4 & Friends tools TLViz or CSVPNG.
You will note that the layout of the data has been inverted with the data rows now representing the 4 monthly sample reading time periods, and the 30 data columns representing the 30 key factors which is the orientation required for TLViz and CSVPNG. This makes for a very wide page, but of course, when using TLViz or CSVPNG to examine the trend data, we do not actually need to read it.
In our next post, we will show you why this conversion from printed table to RR format is so helpful in the way it allows the tabular data to come alive in visual form with very little effort by using a tool such as TLViz.
The last two pages show a relatively easy to read and understand printed table. The table lists, all in one place, what I assume to be what O'Hanlon thinks are the 30 key factors on the ground in Iraq and how they have varied year by year from November 2003 to November 2006.
Here's a version of that table that I have edited for even better visibility and to keep it from covering two pages. (please click on image for full size view):
 The four data columns of the table show the trends for those factors with the data values being captured for the month of November in each of the past 4 years. From a standpoint of printed table readability, limiting the number of trend samples to 4 makes this table much more suited for direct human consumption at the cost of reducing overall trend data quality compared to a set of trend samples for a given factor that showed how that factor changes every month.
This table as text is of course not a readily-reusable (RR) file. However, it was relatively straightforward for us to convert it into RR format and you can download your own copy by right clicking on ohanlon-key-factors.csv. This RR file is ready for examination with Microsoft Excel or even better with the T4 & Friends tools TLViz or CSVPNG.
You will note that the layout of the data has been inverted with the data rows now representing the 4 monthly sample reading time periods, and the 30 data columns representing the 30 key factors which is the orientation required for TLViz and CSVPNG. This makes for a very wide page, but of course, when using TLViz or CSVPNG to examine the trend data, we do not actually need to read it.
In our next post, we will show you why this conversion from printed table to RR format is so helpful in the way it allows the tabular data to come alive in visual form with very little effort by using a tool such as TLViz.
Thursday, January 18, 2007
Creating Readily Reusable Data from Online Tables of Trends in Iraq: a quick example
Here's a quick example of how relatively inaccessible tabular data from a web site can be converted into a readily reusable format.
Starting Point: Tabular data from GlobalSecurity
Step 1. We went to Global Security's Iraq Casualties page and found a table that included one column of monthly data for US Named Dead and second column for US Wounded. The bottom of that page also includes one chart for each of these factors that are worth examining. Note that these charts were not included in the ones we selected from Global Security in our earlier post as we already had charts on US dead and wounded that we had selected from the Iraq Casualty Coalition that we felt were more revealing. We cut and pasted the table from Global Security into Microsoft Excel and played with the data to create two clean columns of CSV data and a time stamp column.
Step 2. We went to Global Security's Boots on the Ground page and cut and pasted the two columns of data showing troops in Iraq and and troops "in theatre" to create a CSV data file which now had 4 data columns.
Step 3. We now had the data in a readily-reusable (RR) form as 4 data column CSV file. We took advantage of this to compute some new data columns derived from the original four columns, namely:
You can take a look at the resulting RR file we have created which now has 11 data columns by downloading it from Iraq-RR-Example.csv. Check it out with Microsoft Excel, or even better this would be a great opportunity to try out TLViz (the TimeLine Visualizer) or the CSVPNG utility - both of which are expressly designed to work with RR data in this format.
You can learn more about these powerful tools in our previous posts: here and here and here and here for TLViz and here for CSVPNG and you can download the latest versions of these powerful utilities from the TrendsThatMatter Download page.
The first payoff of an RR approach is that when tabular data is converted to RR format, it puts you back in the driver seat. You are not dependent on only seeing the charts that some other analyst selected. You can look at every factor. You are not restricted to just the time period that someone else selected. You can zoom in on a period you are most interested in.
A second payoff is that you are not restricted to looking at only the combinations of data (if any) that someone else selected. You can also combine factors together with multiple trends on a single graph. Interactive tools like TLViz make it an order of magnitude easier to create different combinations of key factors and help reveal patterns hiding in the data.
A thrid payoff is that you are not restricted to only looking at the raw data. You can add moving averages and look at the moving average by itself or create a trend graph that shows both the initial raw data and the moving average together as shown in the example below:
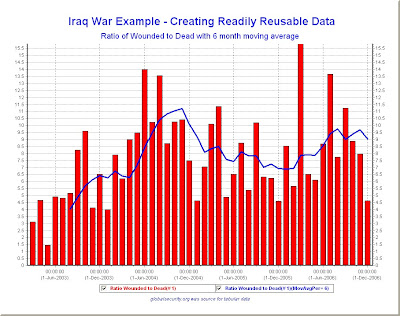
A fourth payoff is that you can now create new computed or derived values such as the 7 new metrics we added on to our starting point of four Global Security factors. This facility to compute or derive new trend data by calculation involving the current set of factors is extremely important at revealing the full value that the data might hold.
The final payoff is that as you gather data from other sources, you can turn this into RR format and then add new columns to extend the your existing RR file.
The example we showed in this post is pretty elementary, starting as it does with only a handful of factors. As we have seen from our work with the Iraq war data so far, there are literally dozens of important factors. If we could put them all into a single RR data set, our ability to understand what is going on would be markedly enhanced and many opportunities for discovery would open up.
We are still a long way from that goal. In our next post, we will give you a little more complex example of RR data for Iraq that involves substantially more of the relevant factors.
In the meantime, I suggest you download and take a look at the Iraq-RR-Example.csv and see what else you can discover from the 11 reported factors that we have assembled for you.
Starting Point: Tabular data from GlobalSecurity
Step 1. We went to Global Security's Iraq Casualties page and found a table that included one column of monthly data for US Named Dead and second column for US Wounded. The bottom of that page also includes one chart for each of these factors that are worth examining. Note that these charts were not included in the ones we selected from Global Security in our earlier post as we already had charts on US dead and wounded that we had selected from the Iraq Casualty Coalition that we felt were more revealing. We cut and pasted the table from Global Security into Microsoft Excel and played with the data to create two clean columns of CSV data and a time stamp column.
Step 2. We went to Global Security's Boots on the Ground page and cut and pasted the two columns of data showing troops in Iraq and and troops "in theatre" to create a CSV data file which now had 4 data columns.
Step 3. We now had the data in a readily-reusable (RR) form as 4 data column CSV file. We took advantage of this to compute some new data columns derived from the original four columns, namely:
- the monthly ratio of wounded to dead
- the monthly change in troop level in Iraq
- the monthly change in troop level in Iraq as a percent of the previous month's level
- the three month trailing moving average of fatalities
- the six month trailing moving average of fatalities
- the 9 month trailing moving average of fatalities
- the monthly total of wounded and dead combined
You can take a look at the resulting RR file we have created which now has 11 data columns by downloading it from Iraq-RR-Example.csv. Check it out with Microsoft Excel, or even better this would be a great opportunity to try out TLViz (the TimeLine Visualizer) or the CSVPNG utility - both of which are expressly designed to work with RR data in this format.
You can learn more about these powerful tools in our previous posts: here and here and here and here for TLViz and here for CSVPNG and you can download the latest versions of these powerful utilities from the TrendsThatMatter Download page.
The first payoff of an RR approach is that when tabular data is converted to RR format, it puts you back in the driver seat. You are not dependent on only seeing the charts that some other analyst selected. You can look at every factor. You are not restricted to just the time period that someone else selected. You can zoom in on a period you are most interested in.
A second payoff is that you are not restricted to looking at only the combinations of data (if any) that someone else selected. You can also combine factors together with multiple trends on a single graph. Interactive tools like TLViz make it an order of magnitude easier to create different combinations of key factors and help reveal patterns hiding in the data.
A thrid payoff is that you are not restricted to only looking at the raw data. You can add moving averages and look at the moving average by itself or create a trend graph that shows both the initial raw data and the moving average together as shown in the example below:

A fourth payoff is that you can now create new computed or derived values such as the 7 new metrics we added on to our starting point of four Global Security factors. This facility to compute or derive new trend data by calculation involving the current set of factors is extremely important at revealing the full value that the data might hold.
The final payoff is that as you gather data from other sources, you can turn this into RR format and then add new columns to extend the your existing RR file.
The example we showed in this post is pretty elementary, starting as it does with only a handful of factors. As we have seen from our work with the Iraq war data so far, there are literally dozens of important factors. If we could put them all into a single RR data set, our ability to understand what is going on would be markedly enhanced and many opportunities for discovery would open up.
We are still a long way from that goal. In our next post, we will give you a little more complex example of RR data for Iraq that involves substantially more of the relevant factors.
In the meantime, I suggest you download and take a look at the Iraq-RR-Example.csv and see what else you can discover from the 11 reported factors that we have assembled for you.
Consolidating the Iraq Trend Charts from Multiple Sources: A step toward ready-viewability
In the past few days, we've posted a total of 21 charts showing trends that matter on the ground in Iraq. These were culled and selected from 4 separate sources and posted in 4 separate posts. You can scroll down the January 2007 posts from January 17th back to January 13th and find all 21 of these charts in relatively close proximity to each other. Our theory is that by bringing them all to one relatively compact place, we make it easier for those who are interested in learning more about what is happening to have access to the combined analysis and reporting talent from the four sources.
What can we do next? We think this approach makes it easier, but it still is not easy. Due to the current limitations of this blog, the graphs that appear in the blog itself are relatively small in size and to get a full grasp of the message of each trend it is necessary to click on each trend graph to get a full size image. This is pretty unwieldy and involves a lot of extra back and forth clicks to navigate to a good sized view of each trend.
Here's a possible approach to make this a bit easier and less time consuming and require far fewer clicks and allow much better navigation back and forth between the different trend charts. What we've done is to take all 21 trend graphs to create a single down-loadable PDF document that will let you easily view all trends up to the full size your screen while navigating back and forth to the chart you want using the full navigational capabilities of Adobe Acrobat (e.g. page down, page up).
Here's the link - Combine-Iraq-Trends Please let us know what you think of this step towards making these important charts rank higher on a ready-viewability scale.
Did you find the navigation easier?
Did having easy access to all trends in full size improve understanding for you?
What other suggestions do you have to make this even easier?
Wednesday, January 17, 2007
The Iraq Situation and Readily-Reusable Data
One of the difficulties I have encountered so far is that the data I would really like to examine first hand is not readily reusable and in some cases is completely unavailable in any form.
The first timeline collaboration principle that you will find on the right hand column of our blog template is:
Admittedly some of these sources have shared their trend data series, but the method they selected means that they are not easy or ready for reuse without investing a lot of time and effort.
For example,
Most people (both decision makers and ordinary citizens) are not particularly good or particularly thrilled by the idea of trying to make sense of trend data contained in a printed or online table.
My experience indicates that almost all adults (I would estimate the number at 90% or more) can make good sense of trend data presented in line graphs or bar graphs). On the other hand, I estimate that fewer than 10% of the people have the skills, interest or time to extract basic information from a trend table like the one on page 5 of the Brookings Iraq Index, or the many tables you can find at GlobalSecurity or at the Iraq Casualty Coalition.
What impact does this lack -- this lack of data / lack of readily reusable data / lack of easily viewable trend data for all key factors -- have on our ability to understand what's going on?
The way this plays out is that for 99% of the population, they will get their understanding of the trends from their most trusted source.
For a small percentage of people (I am guessing under 5% of the population), that trusted source might be one of the ones we have mentioned so far in this series on Iraq Trends or a similar detailed view of the situation that provides some depth and breadth and doesn't rely on just one or two metrics.
For this small group, if their source is Brookings, and they spend the time wading through the 30 page report, they will have a good chance of making good sense of the charts that Brookings selected. Similarly if their source is the State Department and if they wade through the Weekly Status report they will get a picture of the trends that the State Department selected but not the ones that Brookings was paying attention to. If their source is GlobalSecurity or the Iraq Casualty Coalition, they will get a good grasp of the charts presented at those sites.
Even in this small group that goes and gets their trend understanding from one of these useful and detailed sources (or other similar venues) a small percentage will dig any further into the tabular data that is available. The reason: primarily lack of time and secondarily lack of experience possibly combined with self conceived notions that reading tables is hard.
My reading is that few in this small group will consult and combine the trends from multiple sources like those mentioned above to get a broader perspective. Of course, if you have been reading this series of posts, we have done some of that lifting work for you and made it easier (still not easy in my opinion) to become more widely informed of the composite set of trends that are considered important drawn from a mix of analysts who may have vastly different axes to grind.
For a good portion of the rest of the population beyond this small group, the trusted source for trend data will turn out to be television and other mainstream media. Based on what I have seen from the MSM, this group of individuals will likely be exposed to quite limited trend information in any form and will often end up only being exposed to non-specific, non-numerical statements about the situation on the ground.
What to do? What to do?
Glad you asked. The answer for me is straightforward: ready reusability.
Ready reusability for the Iraq Trend data is easy to say and hard (time consuming, error prone) to do right now. In the next couple of posts, I will give you an example of what I mean by transforming some of the tabular data from expert sources into a readaily reusable form. Once the data is ready to go, I will provide some examples of why I think this is so important.
The first timeline collaboration principle that you will find on the right hand column of our blog template is:
1. Share the data series with the chart. Make sure it is readily reausableTo the best of my knowledge, not one of the 4 sources we have consulted so far (Brookings Iraq Index, The State Dept's Iraq Weekly Status, GlobalSeccurity, or the Iraq Casualty Coalition) has made the data that they used for their own analysis and charting both available and readily reusable as a spreadsheet or CSV file.
Admittedly some of these sources have shared their trend data series, but the method they selected means that they are not easy or ready for reuse without investing a lot of time and effort.
For example,
- Brookings Iraq Index does include some trend data tables with important metrics and frequently labels the data values on their charts. Not all of the interesting trend data that appears in the tables is translated into a chart in the report. For example, see the table on page 5 of the January 8th report that shows details of the trends in cause of death for US Troops.
- The Iraq Weekly Status Report from the State Department does not include any trend data at all beyond what they show in their charts. And the time period covered by the charts they have selected is rather short in most cases. For example the crude oil production chart only covers the last 10 weeks and other charts cover less than a year. Only the electricity chart stretches back to the beginning of 2004
- Global Security includes a lot of detailed trend data in tabular form in addition to and complementing the charts they provide. The range of the data presented tabularly tends to cover the entire period from the start of the war until the present.
- The Iraq Casualty Coalition also provides substantial amounts of tabular trend data in addition to their charts and their data covers the entire period from the beginning of the war.
Most people (both decision makers and ordinary citizens) are not particularly good or particularly thrilled by the idea of trying to make sense of trend data contained in a printed or online table.
My experience indicates that almost all adults (I would estimate the number at 90% or more) can make good sense of trend data presented in line graphs or bar graphs). On the other hand, I estimate that fewer than 10% of the people have the skills, interest or time to extract basic information from a trend table like the one on page 5 of the Brookings Iraq Index, or the many tables you can find at GlobalSecurity or at the Iraq Casualty Coalition.
What impact does this lack -- this lack of data / lack of readily reusable data / lack of easily viewable trend data for all key factors -- have on our ability to understand what's going on?
The way this plays out is that for 99% of the population, they will get their understanding of the trends from their most trusted source.
For a small percentage of people (I am guessing under 5% of the population), that trusted source might be one of the ones we have mentioned so far in this series on Iraq Trends or a similar detailed view of the situation that provides some depth and breadth and doesn't rely on just one or two metrics.
For this small group, if their source is Brookings, and they spend the time wading through the 30 page report, they will have a good chance of making good sense of the charts that Brookings selected. Similarly if their source is the State Department and if they wade through the Weekly Status report they will get a picture of the trends that the State Department selected but not the ones that Brookings was paying attention to. If their source is GlobalSecurity or the Iraq Casualty Coalition, they will get a good grasp of the charts presented at those sites.
Even in this small group that goes and gets their trend understanding from one of these useful and detailed sources (or other similar venues) a small percentage will dig any further into the tabular data that is available. The reason: primarily lack of time and secondarily lack of experience possibly combined with self conceived notions that reading tables is hard.
My reading is that few in this small group will consult and combine the trends from multiple sources like those mentioned above to get a broader perspective. Of course, if you have been reading this series of posts, we have done some of that lifting work for you and made it easier (still not easy in my opinion) to become more widely informed of the composite set of trends that are considered important drawn from a mix of analysts who may have vastly different axes to grind.
For a good portion of the rest of the population beyond this small group, the trusted source for trend data will turn out to be television and other mainstream media. Based on what I have seen from the MSM, this group of individuals will likely be exposed to quite limited trend information in any form and will often end up only being exposed to non-specific, non-numerical statements about the situation on the ground.
What to do? What to do?
Glad you asked. The answer for me is straightforward: ready reusability.
Ready reusability for the Iraq Trend data is easy to say and hard (time consuming, error prone) to do right now. In the next couple of posts, I will give you an example of what I mean by transforming some of the tabular data from expert sources into a readaily reusable form. Once the data is ready to go, I will provide some examples of why I think this is so important.
One More Source of Iraq Trend Graphics - Iraq Coalition Casualties
So far, in our previous posts on Iraq we have pulled together a set of 16 different How Are Things Going in Iraq Charts from three different sources. We have:
The 5 charts show:


This brings us to a total of 21 charts. I think you will see that by arranging these together in a somewhat more convenient and time-saving format than the separate originals, your understanding of what's happening in Iraq has been boosted. I think you will also see that being able to look at all 21 one of these in a relatively short period of time by scrolling down this blog allows you to develop more of a gestalt understanding of how all the factors interact and impact on each other.
- 9 trends from the Brookings Iraq Index
- 4 trends from the Department of State Weekly Iraq Status Report
- 3 trends from Global Security.org
The 5 charts show:
- US Soliders Killed with moving avg & event timing - March 2003 - December 30, 2006
- US Soldiers Wounded with moving avg - Sept 6, 2003 - Dec 29, 2006
- IED Fatalities per month - July 2003 - January 2007
- Iraqi Police/Military fatalities - January 2005 - December 2006
- Iraqi Civilian fatalities - January 2005 - December 2006


This brings us to a total of 21 charts. I think you will see that by arranging these together in a somewhat more convenient and time-saving format than the separate originals, your understanding of what's happening in Iraq has been boosted. I think you will also see that being able to look at all 21 one of these in a relatively short period of time by scrolling down this blog allows you to develop more of a gestalt understanding of how all the factors interact and impact on each other.
- How many charts is enough?
- Are we there yet?
- Do we already have everything we need to understand the situation?
- Is it relatively easy for decision makers or interested citizens to get rapid access to all of the most important factors?
- Do we now have the full deck of cards that will allow us to make wise choices?
- Have we arranged things so that automatic monitoring and reporting of key factors enables us to determine quickly whether the actions we take are having the desired effect as we go forward?
More Iraq trend charts from GlobalSecurity.org
Here's a third source of recent trend charts showing what's going on in Iraq from GlobalSecurity.org - Reliable Security Information.
The three trend charts I have selected from their web site are:


The three trend charts I have selected from their web site are:
- US Ground troops in Iraq from March 2004 through December 2006
- Average daily casualties - Iraqi and Coalition from 01 April 2004 through 12 May 2006
- Average weekly attacks by time period 01 April 2004 through 12 May 2006


Tuesday, January 16, 2007
Some Additional Iraq Trends from the Iraq Weekly Status Report
Here are four additional trend charts about the situation on the ground in Iraq drawn from the U.S Dept. of State's Iraq Weekly Status Report (30 pages, January 10, 2007). The State Department describes this report as providing "weekly updates in the eight key areas identified as pillars of U.S. Government policy." You can find the most recent report and previous issues starting at the link shown above.
The first shows crude oil production for the past 10 weeks.
The second shows crude oil export since February 2006
The third shows electricity production compared to electricity demand since January 2004.
The fourth shows the strength of the local Iraqi currency compared to the dollar since April 2nd, 2006
The Iraq Weekly Status Report is one of the sources used to create the Brookings Iraq Index whose trend charts we have been featuring in previous posts..
Please click for full size images.


What Gets Measured Gets Done
Michael O'Hanlon is a co-author (along with Jason H. Campbell) of the Brookings Iraq Index report that we have discussed in several recent posts.
In a recent Brad DeLong post
(Grasping Reality with Both Hands: Brad DeLong's Semi-Daily Journal: Matthew Yglesias and His Commenters Look at the Brookings Institution, Michael O'Hanlon, and Jeff Herf)
I came across the following quote (originally posted here as a comment to Matthew Yglesias post) and found it interesting and relevant to the mission of this site (emphasis added):
My reading is that O'Hanlons' and Brookings' Iraq Index is useful exactly becauseAlso of note, the one guy in Brookings who was actually right about the whole mess, that is, Ivo Daalder, isn't working there anymore. As for the Hanlon's (sic) major contribution to the war of ideas, the Iraq index, the best I can say is that this is a very American idea: the idea that problems can be analyzed and solved if we only quantify them and measure them.
Posted by: Nick Kaufman on January 14, 2007 12:22 AM
- it works hard at identifying the key factors that give us clues to how things are really going in Iraq, and
- it does the heavy lifting work of pulling the measurements of these factors together in a single place and making them available for others to examine and think about.
The converse of the proposition that "problems can be analyzed and solved if we only quantify and measure them" is likely to be more on target. Namely something like:
If we don't identify the key factors, quantify them, measure them, make them available to others, analyze them, and discuss them, then this will severely limit our individual and collective ability to understand the problems we face.Under this new framing (effective measurement leads to greater understanding), we also note that the identification of potential solutions will be sharply limited, much more difficult, and much more a matter of guesswork when such measurement is absent.
One other benefit of a measurement-aided approach is that when a given solution (an intervention) is initiated, the next measurements of these same key factors will provide the essential grist for determining whether that intervention is delivering on its promise.
In other words we might want to designate the idea: what gets measured, gets done as the bugle call order of the day, knowing that measurement, sharing, and collaboration can help us at each step along the way from problem definition to proof that our solutions have actually worked.
In future posts, we will make an attempt to build further on the work started in the Iraq Index and on the measurement work we can cull from other Iraq sources so as to add some substance to the theoretical statements of this post.
In my view, if we are going to find and implement a solution to the deteriorating Iraq situation, we need more quantification, measurement, sharing, analysis, and collaboration and that extensions to and improvements on the Iraq Index can help pave the way.
Subscribe to:
Posts (Atom)