Contrast the clarity of this picture to the graphics in the previous post.
The trend since 1985 makes me wish I could see the past 20 years view. A 10 year view and a 5 year view might provide even more insights.
If you were interested in home ownership, what else would you want to look at? If you find this picture useful, you would likely want to see such things as the trends for:
- Average Home Equity in Today's Dollars
- Average Home Value in Today's Dollars
- Home ownership percentage (but dislayed showing labels on the axes)
- Mortgage rates
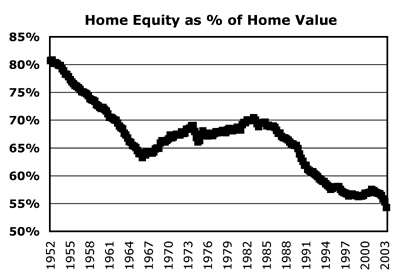
Home Equity Compared to Home Value 
No comments:
Post a Comment