The first view is the 5 year view. This was pretty flat for 3 years, then showed a sharp upswing at the end of 2004.

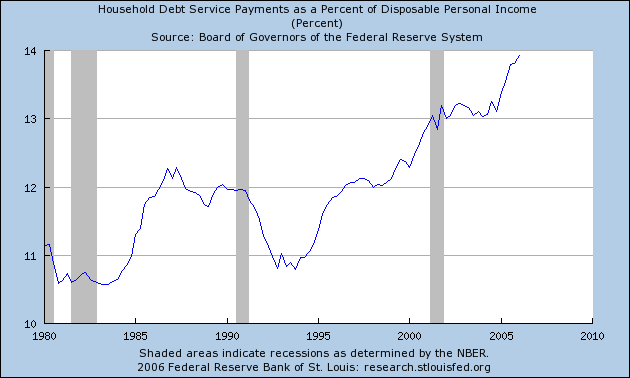
The second chart shows the 25+ year view going back to 1980. Notice the upsweep from 1992 to the present (Q1 2006).
The third is the 10 year chart shows more clearly both the upsweep and 3 year pause.
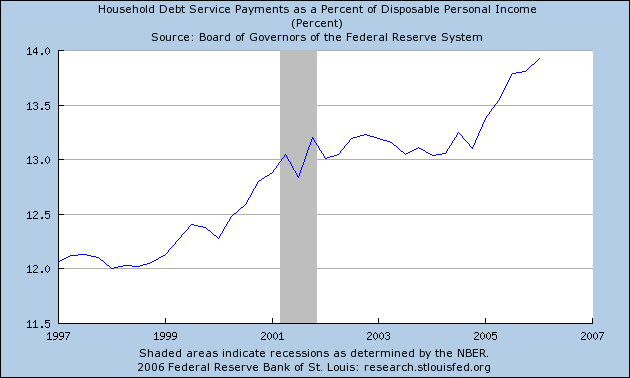
I find these charts give an eye-opening view of a what has been a non-HEADLINE factor that may prove important in how our current economic situation evolves. How much debt can the US public sustain before there begins to be some push back? The more debt service, the smaller the remaining disposable income to deal with the twin factors of rising gas prices and inflation in general and stagnant real median wage.
What do you think?
No comments:
Post a Comment