Starting Point: Tabular data from GlobalSecurity
Step 1. We went to Global Security's Iraq Casualties page and found a table that included one column of monthly data for US Named Dead and second column for US Wounded. The bottom of that page also includes one chart for each of these factors that are worth examining. Note that these charts were not included in the ones we selected from Global Security in our earlier post as we already had charts on US dead and wounded that we had selected from the Iraq Casualty Coalition that we felt were more revealing. We cut and pasted the table from Global Security into Microsoft Excel and played with the data to create two clean columns of CSV data and a time stamp column.
Step 2. We went to Global Security's Boots on the Ground page and cut and pasted the two columns of data showing troops in Iraq and and troops "in theatre" to create a CSV data file which now had 4 data columns.
Step 3. We now had the data in a readily-reusable (RR) form as 4 data column CSV file. We took advantage of this to compute some new data columns derived from the original four columns, namely:
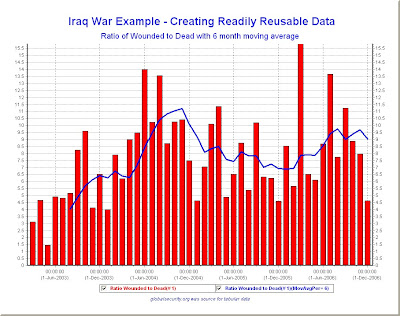
- the monthly ratio of wounded to dead
- the monthly change in troop level in Iraq
- the monthly change in troop level in Iraq as a percent of the previous month's level
- the three month trailing moving average of fatalities
- the six month trailing moving average of fatalities
- the 9 month trailing moving average of fatalities
- the monthly total of wounded and dead combined
You can take a look at the resulting RR file we have created which now has 11 data columns by downloading it from Iraq-RR-Example.csv. Check it out with Microsoft Excel, or even better this would be a great opportunity to try out TLViz (the TimeLine Visualizer) or the CSVPNG utility - both of which are expressly designed to work with RR data in this format.
You can learn more about these powerful tools in our previous posts: here and here and here and here for TLViz and here for CSVPNG and you can download the latest versions of these powerful utilities from the TrendsThatMatter Download page.
The first payoff of an RR approach is that when tabular data is converted to RR format, it puts you back in the driver seat. You are not dependent on only seeing the charts that some other analyst selected. You can look at every factor. You are not restricted to just the time period that someone else selected. You can zoom in on a period you are most interested in.
A second payoff is that you are not restricted to looking at only the combinations of data (if any) that someone else selected. You can also combine factors together with multiple trends on a single graph. Interactive tools like TLViz make it an order of magnitude easier to create different combinations of key factors and help reveal patterns hiding in the data.
A thrid payoff is that you are not restricted to only looking at the raw data. You can add moving averages and look at the moving average by itself or create a trend graph that shows both the initial raw data and the moving average together as shown in the example below:

A fourth payoff is that you can now create new computed or derived values such as the 7 new metrics we added on to our starting point of four Global Security factors. This facility to compute or derive new trend data by calculation involving the current set of factors is extremely important at revealing the full value that the data might hold.
The final payoff is that as you gather data from other sources, you can turn this into RR format and then add new columns to extend the your existing RR file.
The example we showed in this post is pretty elementary, starting as it does with only a handful of factors. As we have seen from our work with the Iraq war data so far, there are literally dozens of important factors. If we could put them all into a single RR data set, our ability to understand what is going on would be markedly enhanced and many opportunities for discovery would open up.
We are still a long way from that goal. In our next post, we will give you a little more complex example of RR data for Iraq that involves substantially more of the relevant factors.
In the meantime, I suggest you download and take a look at the Iraq-RR-Example.csv and see what else you can discover from the 11 reported factors that we have assembled for you.
No comments:
Post a Comment