Edward Tufte is out with a new and inspirational book: Beautiful Evidence which includes a full chapter on the idea of sparklines - small word like graphic elements that can be integrated fully with text and that allow for massive amounts of statistical data to be presented in a compact format that encourages comparison between elements.
Not many software tools are yet available to help create the sparkline graphical elements. One exception is the T4 & Friends utility: CSVPNG that we have talked about in previous posts. CSVPNG has some introduced some new basic capabilities that can let you experiment with creating your own sparklines without having to write all the code yourself. The latest version of CSVPNG can be downloaded from the Trends That Matter download page
Showing posts with label csvpng. Show all posts
Showing posts with label csvpng. Show all posts
Monday, February 12, 2007


Friday, January 19, 2007
Iraq Trend Data: O'Hanlon's Testimony to the Foreign Relations Committee
Michael O'Hanlon who is the lead author of the Brookings Iraq Index testified last week before the Senate Foreign Relations Committee. Here's the 4 page text of his January 10th testimony.
The last two pages show a relatively easy to read and understand printed table. The table lists, all in one place, what I assume to be what O'Hanlon thinks are the 30 key factors on the ground in Iraq and how they have varied year by year from November 2003 to November 2006.
Here's a version of that table that I have edited for even better visibility and to keep it from covering two pages. (please click on image for full size view):
 The four data columns of the table show the trends for those factors with the data values being captured for the month of November in each of the past 4 years. From a standpoint of printed table readability, limiting the number of trend samples to 4 makes this table much more suited for direct human consumption at the cost of reducing overall trend data quality compared to a set of trend samples for a given factor that showed how that factor changes every month.
While most people are not comfortable with reading tables, this one is actually readable and understandable with the application of a modest amount of effort. Please let us know what you think?
This table as text is of course not a readily-reusable (RR) file. However, it was relatively straightforward for us to convert it into RR format and you can download your own copy by right clicking on ohanlon-key-factors.csv. This RR file is ready for examination with Microsoft Excel or even better with the T4 & Friends tools TLViz or CSVPNG.
You will note that the layout of the data has been inverted with the data rows now representing the 4 monthly sample reading time periods, and the 30 data columns representing the 30 key factors which is the orientation required for TLViz and CSVPNG. This makes for a very wide page, but of course, when using TLViz or CSVPNG to examine the trend data, we do not actually need to read it.
In our next post, we will show you why this conversion from printed table to RR format is so helpful in the way it allows the tabular data to come alive in visual form with very little effort by using a tool such as TLViz.
The last two pages show a relatively easy to read and understand printed table. The table lists, all in one place, what I assume to be what O'Hanlon thinks are the 30 key factors on the ground in Iraq and how they have varied year by year from November 2003 to November 2006.
Here's a version of that table that I have edited for even better visibility and to keep it from covering two pages. (please click on image for full size view):
 The four data columns of the table show the trends for those factors with the data values being captured for the month of November in each of the past 4 years. From a standpoint of printed table readability, limiting the number of trend samples to 4 makes this table much more suited for direct human consumption at the cost of reducing overall trend data quality compared to a set of trend samples for a given factor that showed how that factor changes every month.
This table as text is of course not a readily-reusable (RR) file. However, it was relatively straightforward for us to convert it into RR format and you can download your own copy by right clicking on ohanlon-key-factors.csv. This RR file is ready for examination with Microsoft Excel or even better with the T4 & Friends tools TLViz or CSVPNG.
You will note that the layout of the data has been inverted with the data rows now representing the 4 monthly sample reading time periods, and the 30 data columns representing the 30 key factors which is the orientation required for TLViz and CSVPNG. This makes for a very wide page, but of course, when using TLViz or CSVPNG to examine the trend data, we do not actually need to read it.
In our next post, we will show you why this conversion from printed table to RR format is so helpful in the way it allows the tabular data to come alive in visual form with very little effort by using a tool such as TLViz.
Thursday, January 18, 2007
Creating Readily Reusable Data from Online Tables of Trends in Iraq: a quick example
Here's a quick example of how relatively inaccessible tabular data from a web site can be converted into a readily reusable format.
Starting Point: Tabular data from GlobalSecurity
Step 1. We went to Global Security's Iraq Casualties page and found a table that included one column of monthly data for US Named Dead and second column for US Wounded. The bottom of that page also includes one chart for each of these factors that are worth examining. Note that these charts were not included in the ones we selected from Global Security in our earlier post as we already had charts on US dead and wounded that we had selected from the Iraq Casualty Coalition that we felt were more revealing. We cut and pasted the table from Global Security into Microsoft Excel and played with the data to create two clean columns of CSV data and a time stamp column.
Step 2. We went to Global Security's Boots on the Ground page and cut and pasted the two columns of data showing troops in Iraq and and troops "in theatre" to create a CSV data file which now had 4 data columns.
Step 3. We now had the data in a readily-reusable (RR) form as 4 data column CSV file. We took advantage of this to compute some new data columns derived from the original four columns, namely:
You can take a look at the resulting RR file we have created which now has 11 data columns by downloading it from Iraq-RR-Example.csv. Check it out with Microsoft Excel, or even better this would be a great opportunity to try out TLViz (the TimeLine Visualizer) or the CSVPNG utility - both of which are expressly designed to work with RR data in this format.
You can learn more about these powerful tools in our previous posts: here and here and here and here for TLViz and here for CSVPNG and you can download the latest versions of these powerful utilities from the TrendsThatMatter Download page.
The first payoff of an RR approach is that when tabular data is converted to RR format, it puts you back in the driver seat. You are not dependent on only seeing the charts that some other analyst selected. You can look at every factor. You are not restricted to just the time period that someone else selected. You can zoom in on a period you are most interested in.
A second payoff is that you are not restricted to looking at only the combinations of data (if any) that someone else selected. You can also combine factors together with multiple trends on a single graph. Interactive tools like TLViz make it an order of magnitude easier to create different combinations of key factors and help reveal patterns hiding in the data.
A thrid payoff is that you are not restricted to only looking at the raw data. You can add moving averages and look at the moving average by itself or create a trend graph that shows both the initial raw data and the moving average together as shown in the example below:
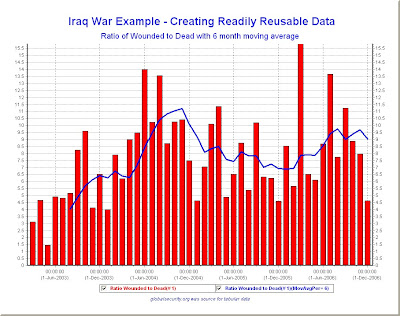
A fourth payoff is that you can now create new computed or derived values such as the 7 new metrics we added on to our starting point of four Global Security factors. This facility to compute or derive new trend data by calculation involving the current set of factors is extremely important at revealing the full value that the data might hold.
The final payoff is that as you gather data from other sources, you can turn this into RR format and then add new columns to extend the your existing RR file.
The example we showed in this post is pretty elementary, starting as it does with only a handful of factors. As we have seen from our work with the Iraq war data so far, there are literally dozens of important factors. If we could put them all into a single RR data set, our ability to understand what is going on would be markedly enhanced and many opportunities for discovery would open up.
We are still a long way from that goal. In our next post, we will give you a little more complex example of RR data for Iraq that involves substantially more of the relevant factors.
In the meantime, I suggest you download and take a look at the Iraq-RR-Example.csv and see what else you can discover from the 11 reported factors that we have assembled for you.
Starting Point: Tabular data from GlobalSecurity
Step 1. We went to Global Security's Iraq Casualties page and found a table that included one column of monthly data for US Named Dead and second column for US Wounded. The bottom of that page also includes one chart for each of these factors that are worth examining. Note that these charts were not included in the ones we selected from Global Security in our earlier post as we already had charts on US dead and wounded that we had selected from the Iraq Casualty Coalition that we felt were more revealing. We cut and pasted the table from Global Security into Microsoft Excel and played with the data to create two clean columns of CSV data and a time stamp column.
Step 2. We went to Global Security's Boots on the Ground page and cut and pasted the two columns of data showing troops in Iraq and and troops "in theatre" to create a CSV data file which now had 4 data columns.
Step 3. We now had the data in a readily-reusable (RR) form as 4 data column CSV file. We took advantage of this to compute some new data columns derived from the original four columns, namely:
- the monthly ratio of wounded to dead
- the monthly change in troop level in Iraq
- the monthly change in troop level in Iraq as a percent of the previous month's level
- the three month trailing moving average of fatalities
- the six month trailing moving average of fatalities
- the 9 month trailing moving average of fatalities
- the monthly total of wounded and dead combined
You can take a look at the resulting RR file we have created which now has 11 data columns by downloading it from Iraq-RR-Example.csv. Check it out with Microsoft Excel, or even better this would be a great opportunity to try out TLViz (the TimeLine Visualizer) or the CSVPNG utility - both of which are expressly designed to work with RR data in this format.
You can learn more about these powerful tools in our previous posts: here and here and here and here for TLViz and here for CSVPNG and you can download the latest versions of these powerful utilities from the TrendsThatMatter Download page.
The first payoff of an RR approach is that when tabular data is converted to RR format, it puts you back in the driver seat. You are not dependent on only seeing the charts that some other analyst selected. You can look at every factor. You are not restricted to just the time period that someone else selected. You can zoom in on a period you are most interested in.
A second payoff is that you are not restricted to looking at only the combinations of data (if any) that someone else selected. You can also combine factors together with multiple trends on a single graph. Interactive tools like TLViz make it an order of magnitude easier to create different combinations of key factors and help reveal patterns hiding in the data.
A thrid payoff is that you are not restricted to only looking at the raw data. You can add moving averages and look at the moving average by itself or create a trend graph that shows both the initial raw data and the moving average together as shown in the example below:

A fourth payoff is that you can now create new computed or derived values such as the 7 new metrics we added on to our starting point of four Global Security factors. This facility to compute or derive new trend data by calculation involving the current set of factors is extremely important at revealing the full value that the data might hold.
The final payoff is that as you gather data from other sources, you can turn this into RR format and then add new columns to extend the your existing RR file.
The example we showed in this post is pretty elementary, starting as it does with only a handful of factors. As we have seen from our work with the Iraq war data so far, there are literally dozens of important factors. If we could put them all into a single RR data set, our ability to understand what is going on would be markedly enhanced and many opportunities for discovery would open up.
We are still a long way from that goal. In our next post, we will give you a little more complex example of RR data for Iraq that involves substantially more of the relevant factors.
In the meantime, I suggest you download and take a look at the Iraq-RR-Example.csv and see what else you can discover from the 11 reported factors that we have assembled for you.
Thursday, January 11, 2007
Some Background on the T4 & Friends Project
In several previous posts we have mentioned the T4 & Friends project. If you want to learn more about this project, you can check out the HP T4 & Friends web site where you can download the general purpose TLViz and CSVPNG software. Additional valuable information can be found on the T4 FAQ page where at the bottom you will also discover some links to valuable related documents.
Initially and on the surface T4 was a project that was intended to make things better for OpenVMS Engineering as it carried out various performance analysis duties. Converting proprietary format performance trend data to readily reusable (R-R) format turned out to be both easy and amazingly powerful. This step alone was a huge win as we were able to use the powerful features of tools such as Excel to help us do our jobs better.
Then, suddenly, tools such as TLViz the timeline visualizer and the versatile CSVPNG utility came on the scene and added at least another order of magnitude productivity benefit to our work. With better downstream tools, more and more people were able to see the value of converting proprietary data formats to the readily-reusable T4-style format so that they could benefit form the downstream tools such as TLViz and CSVPNG, not to mention Excel or MySQL.
As the number of converters and extractors came on the scene to create R-R data, it became clear that the T4 & Friends project provided value well beyond VMS and even well beyond situations where trend data was needed for system performance analysis. The more collectors that were built, the more it was clear that Readily-Reusable data in CSV format combined with tools such as TLViz and CSVPNG were truly universal in scope and available as helpers on any project involving trend data.
Tying things together: This blog sets out as a fundamental assumption that as we learn together how to better harness trend data our ability to create the future that we want for ourselves on this planet will be enhanced.
In upcoming posts, we will be looking into how we might use Ready-Reusability combined with the T4 downstream tools TLViz and CSVPNG to look at the trend data that is most important to us in our lives.
We are also going to be looking at how we might make our downstream tool capabilities even better as well as looking to how we can automate the creation of R-R data from an ever growing set of collectors and extractors reporting on the most important factors controlling the most important aspect of our lives.
Wednesday, January 10, 2007
CSVPNG – A Handy Utility for Readily-Reusable (R-R) Data
The T4 & Friends project at HP we mentioned in earlier posts was at its foundation a project that converted trend data from its original complex format into Readily-Reusable (R-R) format as CSV files. We discovered that any trend data could be so converted and that in most cases the transformation was straightforward, relatively painless and often quite rapid.
As a result of the T4 project, more complex data from a variety of sources was converted to R-R format. Those with interests in this data were then able to enjoy the possibility of looking at it with Excel, loading it into their favorite database or in many cases, analyzing and reporting on what the data meant using TLViz.
We sometimes find it convenient to use the metaphor that
- data is collected ‘upstream’,
- it is saved in R-R format in historical ‘reservoirs’ for possible future use, and
- it is fed, as needed into ‘downstream’ tools for analysis, reporting, collaboration, …
Since no single such downstream tool does everything you might want, the availability of growing reservoirs of R-R data in CSV format systematically increased the possible value of building new tools or incrementally improving existing tools to take advantage and convert the potential value into real value.
CSVPNG (CSV file to Portable Network Graph Utility) is one such development that has blossomed in the world of ready-reusability. Developed in 2003 by Pat Moran of Hewlett Packard, CSVPNG’s initial purpose was to live up to its name – that is to convert CSV trend data automatically into a set of PNG graphics. These were then all embedded in a single output HTML page. Just this one feature alone added considerable value by automating the output of any sets of standard charts that you might always want to examine.
CSVPNG has then proceeded over the past 4 years to transform itself through a series of more than 100 improvements and extensions. You can download a copy of this great tool from the T4 & Friends web page or from TrendsThatMatter.
CSVPNG is written in C and has been made available for a steadily growing number of platforms including DOS under Windows, Linux, HP-UX, and OpenVMS on both Alpha and Integrity servers.
Here’s a brief rundown of some of the things you can do with R-R CSV data using CSVPNG. For a full list of possible benefits, be sure to examine the CSVPNG.TXT file thoroughly after you have downloaded the kit. If you are generating readily-reusable data in CSV format, CSVPNG will surely save you time in managing this data and will help make sure that you don't have to reinvent the wheel.
- Automatically create a selected set of graphs and format as html or PDF
- Slice and dice files to select out just the factors you want and just the time periods you are interested in. The trimmed down result can be automatically graphed and/or used to generate a new reduced file that satisfies the R-R rules. These files could then be fed into other tools such as TLViz or Excel.
- Combine R-R data from several files into a single synchronized file
- Search using expert rules for “interesting” conditions and then display only those charts for cases where one or more conditions were met
- Carryout column arithmetic to create new factors by recombining several original factors.
Here’s a sample graphic output from CSVPNG showing how it can find and highlight a peak period as well as display the original data with moving average value all in a single chart. The blue represents the raw data value, the red line shows the moving average, and the highlighted time interval identifies the peak interval.

The more R-R data you have to deal with, the more valuable you are likely to find the capabilities for CSVPNG for helping you automate and keep on top of all this data.
Subscribe to:
Posts (Atom)