I've included a few that I liked best here for reference. The whole article is well worth reading. What I would love to see someone address is how the liquidity growth that we can see in the recently resurrected M3 charts (see previous posts) intersects with the housing market trends.
For example, will the extra liquidity in the system change (or soften) the outcome of these trends?
General Commentary on the Charts. I liked the long time sweep of these charts and how the chart title explicitly included the date of the most recent data point (which is not always obvious in many trend charts). I also liked the way that Gary skillfully used comparison of pairs of variables to bring important features of what is going on more to the surface.

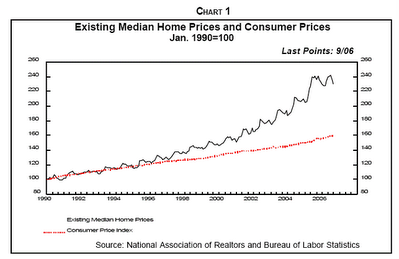
Chart 1. Note the long sweep of this chart plotting from 1990 to Sept 2006 and how these two metrics (median house price and cpi index) were initially parallel and then diverged at an accelerating rate.

Chart 2. This chart has a sweep that goes all the way back to 1890! Note how relatively stable this metric (Real Quality Adjusted House Price) was from 1950 to about 1995 and the dramatic acceleration in the last 11 years.

Chart 8. This chart plots from January 2000 through Sept 2006 and shows the Median Nationwide Single Family Home Sale Price in Red and the year over year percentage change in median home sale price in Black (right hand scale). Note the sharp spike up in the year over year percentage change in 2005 and the even sharper spike downward starting about November 2005.

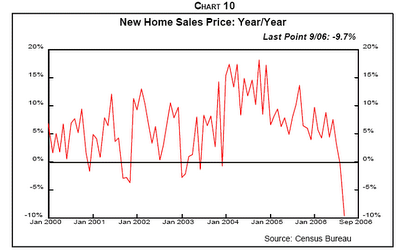
Chart 10. New Home Sales Price year over year percentage change. This chart would be even better if it showed a 3 month or 6 month moving average. Note the slow slope downward starting about January 2004 and the way in which this metric falls off the cliff beginning about June 2006.

Chart 11. This chart shows the period from August 1988 to Sept 2006. This is a particularly powerful chart. It shows the relationship between total new single family home sales and Months Supply of Homes for sale. Note how the totals sales figure accelerates from about 400,000 per year in 1992 up to about 1.3 million per year in 2005 followed by a drop off to approximately 1 million per year in recent days.
Note also how stable the months supply of inventory is (ranging from 3.5 to 4.5 months) from about 1997 until 2005, and then how this metric skyrockets to over 7 months of inventory in Sept 2006.
Comment: using months of inventory has the effect of accentuating the visual impact of the curve when the sales figure is changing rapidly in either direction as the rate of sales is used in the calculation for months of inventory. A chart showing total inventory compared to total sales would show a similar pattern but with less exaggeration.
You can check out the full article at http://frontlinethoughts.com/ for more details.
No comments:
Post a Comment